
In AI Strategy Studio, testing and evaluating your strategy's historical performance requires no coding and takes only seconds: before you watch a symbol live or run a strategy on a virtual account, test your strategy on past chart candles in the Test tab. The test engine accurately simulates your entry, stop loss, take profit targets, break-even and trailing stop rules with your starting balance, risk percentage and realistic broker costs, draws every trade on the chart, and lets you replay any trade step by step. The Test tab will be released to everyone in the near future.
Example: on EURUSD (1-hour timeframe), you open the Test tab, keep the period on 90 days with a $5,000 starting balance, 1% risk per trade and standard broker costs, and click Run test. You inspect the balance curve, win rate, profit factor and max drawdown, click a trade on the chart to replay it, and finish by clicking Run on a virtual account to start a live run.
Choose the period, Money settings and run the test
Open your symbol and timeframe in 4CM-AI Charts.
Open your strategy in AI Strategy Studio and switch to the Test tab.
At the top of the tab, select a past period: 60 days, 90 d (the 90-day default), 180 days, 1 year or From… (to pick a custom start date up to today).
Check the Money settings including starting balance (
Start with ($)from$1,000to$1,000,000), risk percentage per trade (Risk a trade (%)) and cost model (Costs: standard, Raw/ECN, crypto or no costs), and click Run test.
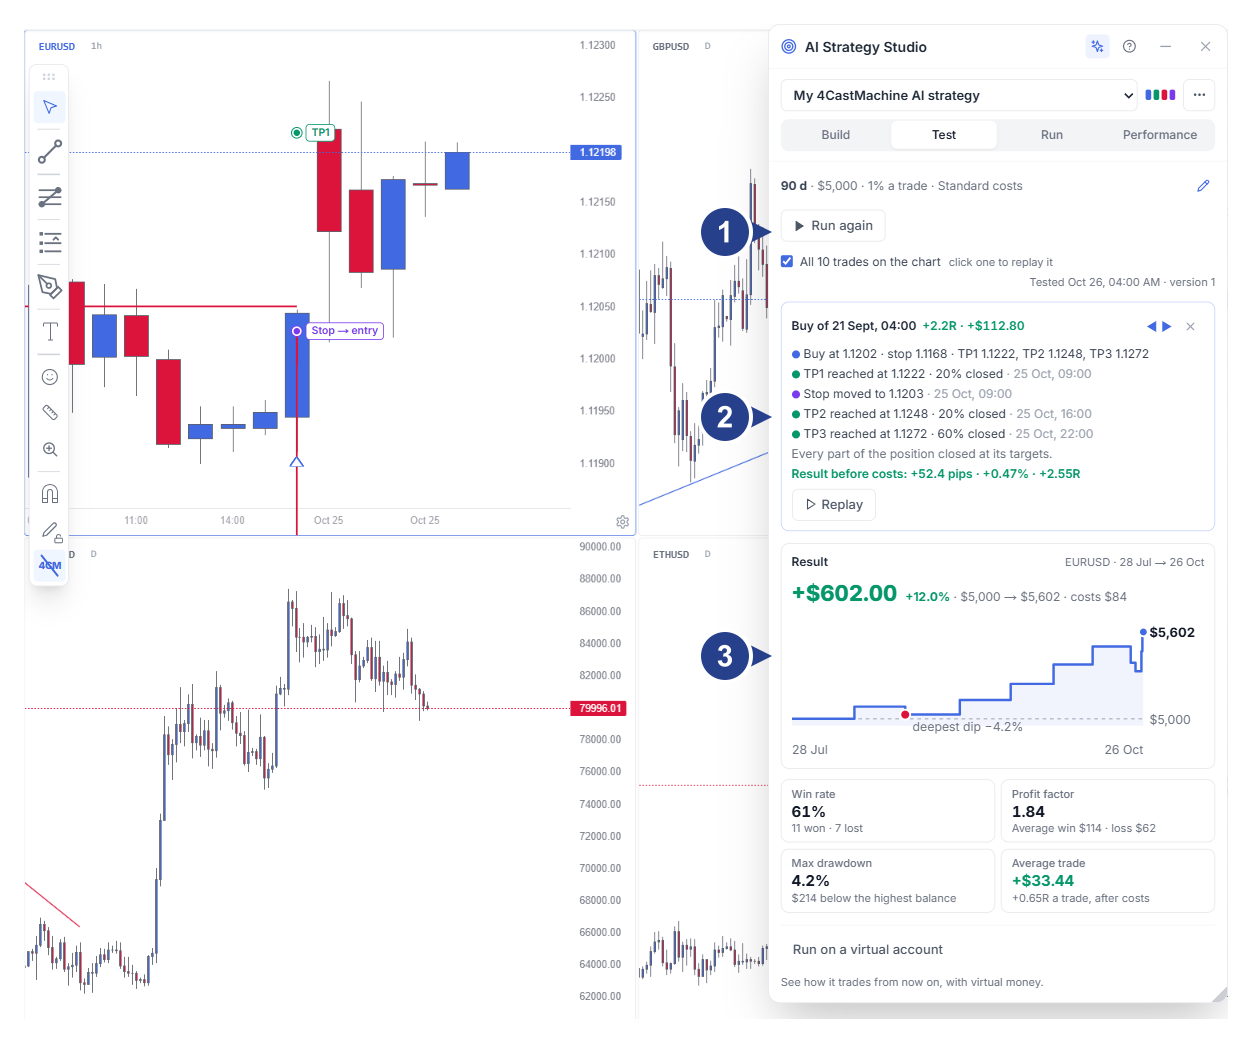
Period selector, Money settings summary and the All N trades on the chart checkbox
Step-by-step trade walk card with the Replay button
The Result card with net profit, balance curve, key metrics and the Run on a virtual account button
Read the result cards, period breakdown and trade replay
When the test finishes, full performance details appear across these cards:
The Result card and key metrics: net dollar profit, percentage return, total broker costs, balance curve, win rate, profit factor, max drawdown and average trade (in
Rand dollars) along with the Edge confidence badge.Period breakdown (Month by month / Week by week) and the How the trades ended card: a bar chart of profit or loss for each month or week and a breakdown of how trades closed (all targets reached, partial target exits, break-even, trailing stop or initial stop loss).
The How this test was run card and step-by-step replay (Replay): a summary of the test assumptions (starting balance, risk and fee model) and the ability to click any trade to replay its path candle by candle on the chart.
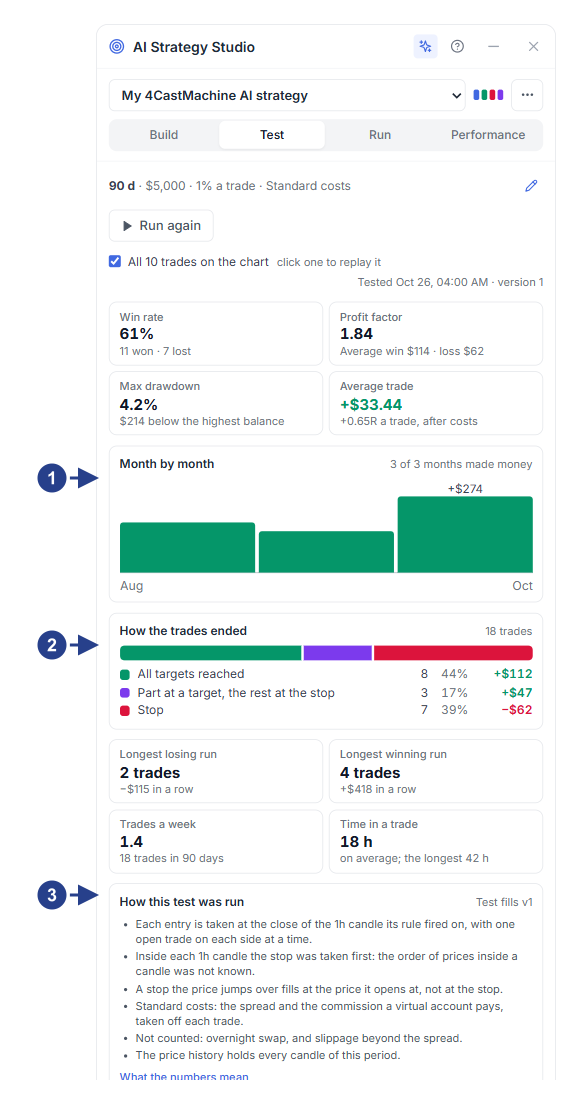
Month-by-month (By month) or week-by-week (By week) performance bar chart
The How the trades ended card (breakdown of exits at targets, partial exits and stop loss)
The How this test was run card with candle-fill, fee and price-gap assumptions
Start a live run on a virtual account from the bottom of the Test tab
At the bottom of the Test tab, click Run on a virtual account to open the Run tab and start a live forward test on a virtual account.