
The first time you sign in to the Web App, a few short windows open one after another. Then the chart page appears. Get these first three minutes right, and from day one you see only the symbols of your own markets. Your first alert starts watching the price for you the same day. You no longer have to sit at the chart for hours, waiting for price to reach your zone and for the right technical conditions.
This guide walks you through that path step by step. You accept the terms and choose your markets. Then you get to know the chart page, read a forecast and create your first alert.
Example: BTCUSD on the 4h timeframe. The alert tells you when price enters the 4h Buy zone and a bullish Hammer or Engulfing candle closes on 1h. A forecast shows the most likely price path. An alert tells you when to look. The decision is yours. The prices in this guide are examples, not advice.
Accept the terms and choose your markets
The first windows show the site's legal texts, one at a time. Scroll each text to the end, tick the checkbox and press Agree and continue. On the last text, the button reads Agree and start.
Next, the Welcome to ForecastCity! window opens. Its job is to keep your workspace uncluttered, so you can focus on the markets you trade.
For example, if you do not trade indices, untick the Indices card. From then on, index symbols stay out of your lists and your symbol search. You can bring a market back later from the profile menu.
At first, all four cards are ticked: Forex, Commodities, Cryptos and Indices. Untick the markets you do not trade.
Press Get Started. The chart page, 4CM-AI Charts, opens.
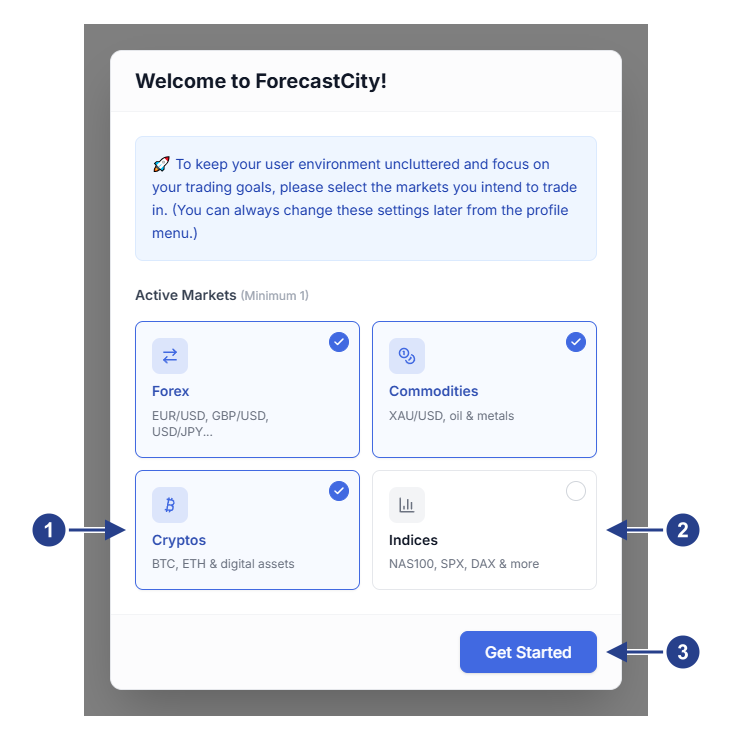
Cryptos: ticked, so crypto symbols show in your lists and in the symbol search.
Indices: not ticked, so index symbols stay out of your lists and the symbol search.
Get Started: saves your choice and opens the chart page.
Get to know the chart page
The chart page has four main parts. Learn where each part is once, because the other guides refer to them by these names.
The Watchlists panel, beside the chart, has one tab for each market you chose.
The top toolbar has the timeframes on its left. On its right are the icons, including the lightning icon (Alerts) and your account icon, which opens the profile menu.
The drawing toolbar, beside the chart, holds the tools for lines and shapes. At its bottom, the 4CM button hides the forecast on the active chart or shows it again.
The forecast panel, titled 4CastMachine AI, has one row for each timeframe. Each row gives the direction and the pivot of that timeframe's forecast.
On most laptops, the top toolbar shows only icons. Rest the mouse on an icon to see its name. Only larger monitors show the names beside the icons.
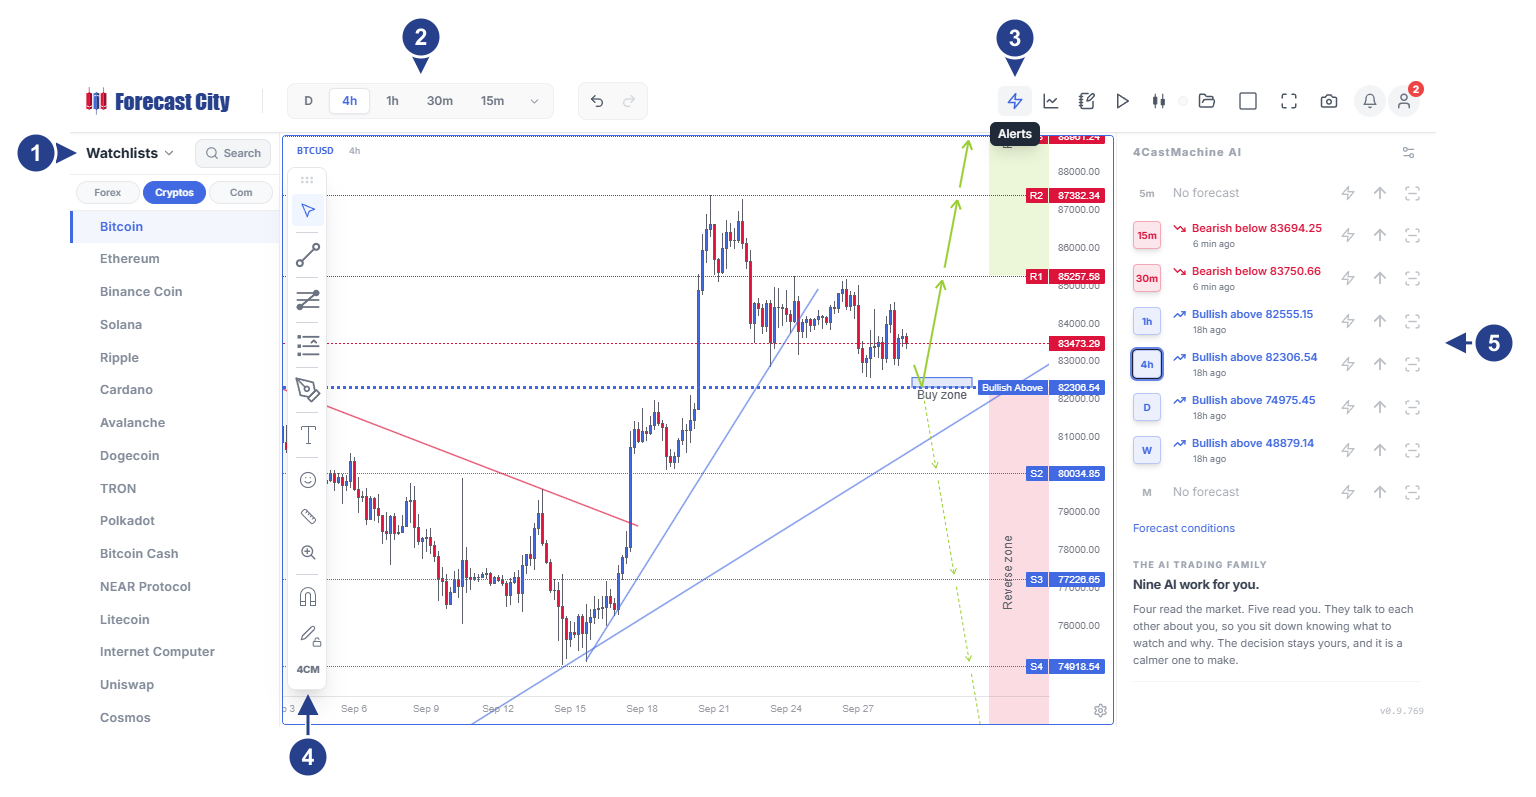
Watchlists: the symbols of the markets you chose, with one tab for each market.
The timeframes of the chart, on the left of the top toolbar. Here 4h is chosen.
The lightning icon. Its name, Alerts, shows while the mouse rests on it.
4CM: hides the forecast on this chart or shows it again.
4CastMachine AI: one row for each timeframe, with the direction and the pivot of its forecast.
Open a symbol and read the forecast
Click the symbol name at the top left of the chart, type BTCUSD and pick it from the list.
In the top toolbar, click 4h.
In the forecast panel, find the 4h row. It reads something like Bullish above 82306.54.
The 4h row tells you two things. Bullish means the direction of the forecast is up. The number 82306.54 is the pivot, the key price of this forecast. While price stays above 82306.54, the upward path is the more likely one.
Each row of the forecast panel has one of three shapes:
Bullish above 82306.54: the forecast is up, and its pivot is 82306.54.
Bearish below 83694.25: the forecast is down, and its pivot is 83694.25.
Range 81971.11 ~ 85116.24: the forecast sees price moving sideways between 81971.11 and 85116.24.
Under each line, the forecast panel shows how fresh that forecast is, for example 6 min ago. Click the row of another timeframe to add that timeframe's guide-lines to the chart. Click the row again to hide them. The arrows and zones of a timeframe show only on a chart of that timeframe.
Create your first alert
An alert that only waits for price to reach a number exists in every charting app. What you can build here is unique. Your first alert watches the Buy or Sell zone of the 4h forecast and waits for a confirming candle on 1h. So the alert tells you when the forecast zone and the candles point the same way.
In the top toolbar, click the lightning icon (Alerts) and press +. The alert editor opens on the Conditions tab.
In the first row, choose 4CM-AI and then 4h. Then choose the zone. If the 4h chart shows a Buy zone, choose price enters Buy zone. If it shows a Sell zone, choose price enters Sell zone. The zone appears under Zones, with its upper and lower prices.
Press + Add condition. In the new row, choose Candles and set the timeframe to 1h.
Click Pattern…. If you chose the Buy zone, tick Hammer and Engulfing under Bullish. If you chose the Sell zone, tick Shooting Star and Engulfing under Bearish. Then click outside the list. The button now reads 2 patterns.
Press Create. The alert appears in the list of the Alerts panel as Active.
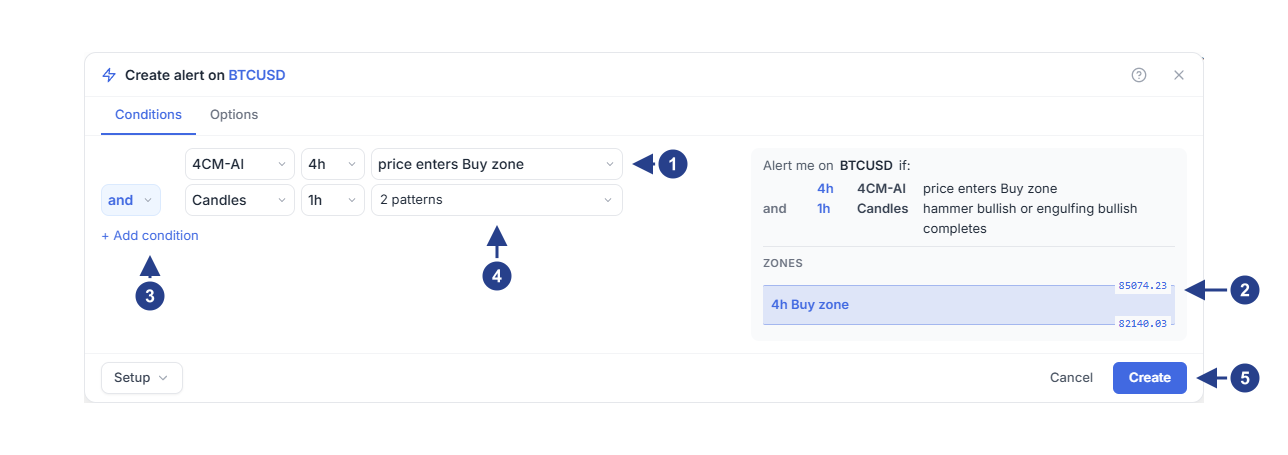
The first condition: 4CM-AI, 4h and price enters Buy zone.
Zones: the 4h Buy zone the alert watches, with its upper and lower prices.
+ Add condition: adds the second row.
The second condition: Candles, 1h and 2 patterns.
Create: saves the alert, which starts watching right away.
From this moment, the alert watches the market for you. Say you save it at 09:00. BTCUSD trades at 85600, above the 4h Buy zone, which reaches up to 85074.23.
At 11:20, price falls to 84900 and enters the Buy zone. The alert remembers this entry.
At 13:00, the 1h candle that opened at 12:00 closes as a Hammer. Both conditions are now true, and the alert sends you its notification at that moment.
A bearish forecast works the same way. Price enters the Sell zone, and then a Shooting Star or a bearish Engulfing candle closes on 1h.
For this alert, the order of the zone entry and the candle pattern matters. The alert remembers a zone entry until the alert fires. A candle pattern counts only until the next 1h candle closes. So if the pattern forms first, price must enter the zone before the next 1h candle closes for the alert to fire. If the entry comes later, the alert waits for a new pattern after the entry. When the alert fires, look at where price and the current zone are on the chart before you decide anything.
The zone condition is explained in detail in Get an alert when price reaches a forecast zone.
Candle patterns are explained in detail in Create candlestick pattern alerts.
Use the profile menu
The profile menu opens when you click your account icon, at the right end of the top toolbar. It has these rows:
Your name: rest the mouse on it to open the account menu. Its options are Subscription Plans & Pricing, Your profile, Settings and billing, Refer a friend, Invite & Earn and MetaTrader Accounts.
AI Trading Journal: your trading journal.
What's New: news about the product.
Help Center: these guides, in a panel beside the chart, so the chart stays open.
Keyboard shortcuts: the list of keyboard shortcuts. The shortcut for this list itself is
Ctrl+/.Theme: a light or a dark look, or the look your computer uses.
Drawings toolbar: a switch that shows or hides the drawing toolbar.
Symbols Panel (the Watchlists panel) and 4CM-AI Panel (the forecast panel): each row has three buttons. The left button places the panel on the left, the middle button hides it and the right button places it on the right.
Can I use the Web App on a phone?
The Web App is designed for computer monitors, not for phones. You get the most out of it on a computer. If you open it on a phone, many of its features still work. A dedicated app for phones is coming soon.