
When you open a trading platform, every price chart is drawn with the exact same green and red candlesticks. Because the charts look alike on the surface, most beginners assume every market moves the same way. In reality, every symbol on your screen belongs to one of four distinct asset classes: Forex, Stock Indices, Commodities, or Crypto.
Behind the candlesticks, completely different buyers and sellers drive each of those four markets. Central banks keep currencies balanced, retirement funds push stock indices higher, bond yields and physical supply drive Gold and Oil, and leveraged traders fuel 24/7 Crypto breakouts. Once you understand who moves each market and when their volume peaks, you stop fighting the chart.
In ForecastCity, 4CastMachine AI maps the active trend, key Buy zone, Sell zone, and Reverse zone, and daily volatility on every symbol in seconds. You can then choose the market that matches your daily schedule and trade it with the right stop distance and lot size.
Step-by-step real-world example: At 08:00 GMT in London, EURUSD reaches the top of its three-week channel at 1.1257 inside the Sell zone. Because major currency pairs spend roughly 70% of their time inside ranges, a prepared trader looks for a bearish bounce from 1.1257 toward S1 at 1.1113. Five hours later, at 09:30 EST in New York, NAS100 breaks out above its Buy zone (28824.81 to 29149.41) as Wall Street opens, rallying 700 points toward R2 at 29961.05. Knowing each market's DNA lets you fade the Euro ceiling in the morning and ride the Nasdaq breakout in the afternoon.
The four-panel diagram below compares the price personality of all four markets side by side. Each panel shows how 4CastMachine AI plots the active zones and yellow-green forecast arrows on 4CM-AI Charts.
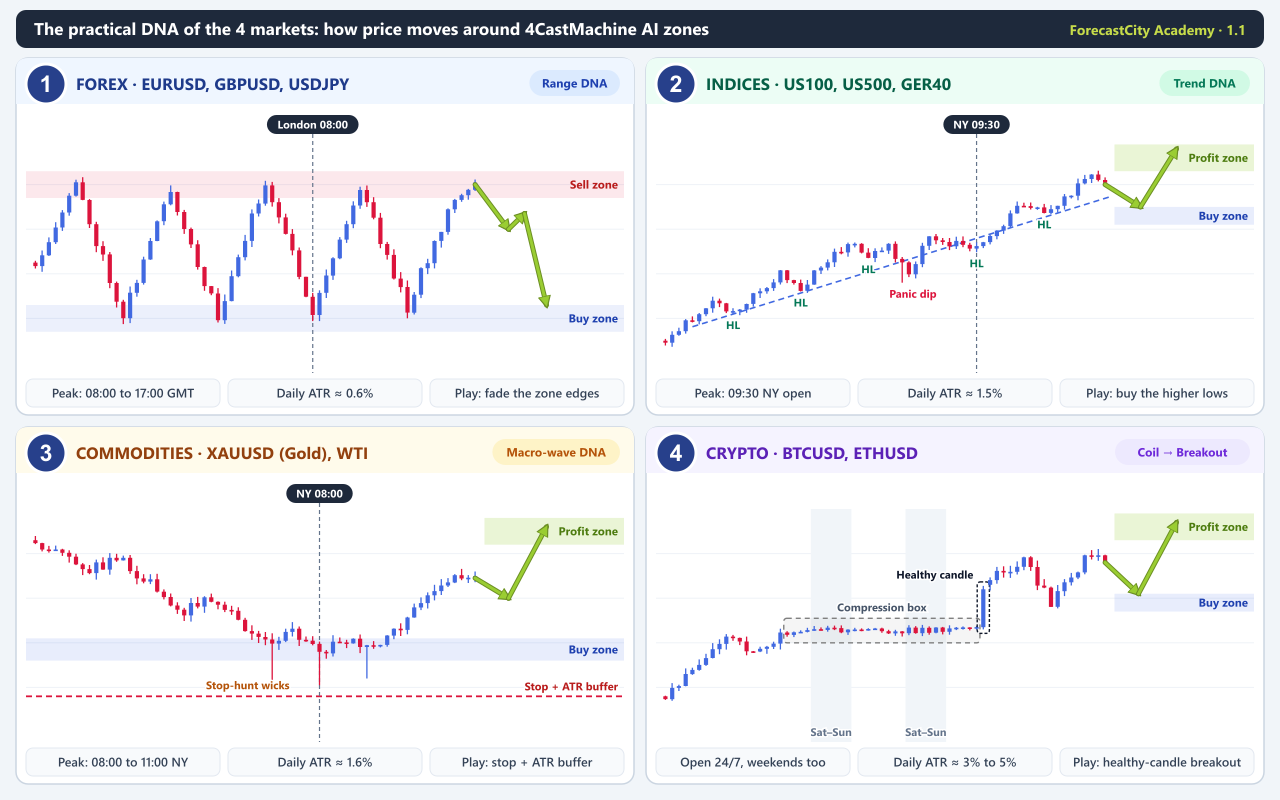
- Forex (EURUSD, GBPUSD, USDJPY): Two central banks pull against each other, keeping price inside channels between the Sell zone and Buy zone about
70%of the time. The London open at08:00 GMToften starts the next clean swing. - Stock Indices (US100, US500, GER40): Stock indices drop weak companies and add growing leaders, creating a long-term upward trend. Price climbs in steps of Higher Lows (
HL), and the biggest moves start at the09:30 ESTNew York open. - Commodities (XAUUSD, WTI): Gold and Oil move in multi-week waves driven by bond yields, inflation, and physical supply. Deep wicks often sweep tight stops inside the Buy zone, so your stop needs an
ATRbuffer below the zone. - Crypto (BTCUSD, ETHUSD): Digital assets trade
24/7, including weekends, and often coil inside a tight multi-day box. Price then breaks out with a healthy candle toward the Profit zone.
How Forex moves
In the Foreign Exchange (Forex) market, you never buy or sell a single currency in isolation. Every symbol is quoted as a currency pair that measures the value of one national currency against another, such as the Euro against the US Dollar in EURUSD. When EURUSD trades at 1.1200, one Euro costs $1.12; clicking Buy buys Euros and sells US Dollars at the same time.
Why does EURUSD behave so differently from Gold or Bitcoin? Both Europe and the United States have powerful central banks: the European Central Bank (ECB) and the Federal Reserve (Fed): that actively manage inflation and central bank interest-rate differentials. If the Euro rises too high, European exports become too expensive; if it falls too far, European import inflation rises.
Because two strong central banks pull against each other like two evenly matched tug-of-war teams, neither currency collapses to zero. Instead, major Forex pairs act like a rubber band that stretches toward an expensive ceiling or a cheap floor and snaps back toward fair value. As a result, major pairs spend roughly 70% of their time oscillating inside multi-week ranges and channels.
To trade Forex effectively, divide currency pairs into two practical groups based on what moves them each day:
- Major pairs (EURUSD, GBPUSD, USDJPY, USDCHF): These pairs pair the US Dollar against the world's largest economies. They move mainly when traders reprice interest-rate expectations around central bank speeches, US jobs data, or monthly CPI inflation and FOMC announcements.
- Commodity currencies (AUDUSD, USDCAD, NZDUSD): Australia exports iron ore and gold, while Canada is a top exporter of crude oil. When crude oil prices rally, foreign buyers need more Canadian Dollars to pay Canadian oil producers, which strengthens
CADand pushes commodity currency pairs like USDCAD downward.
Forex is open 24 hours a day from Monday morning in Sydney to Friday evening in New York, but volume is not equal across the clock. During quiet Asian hours (00:00 to 07:00 GMT), EURUSD and GBPUSD often drift inside a narrow 20 to 30 pip box. The deepest liquidity arrives during the London session (08:00 to 16:00 GMT) and peaks during the London and New York overlap (13:00 to 17:00 GMT).
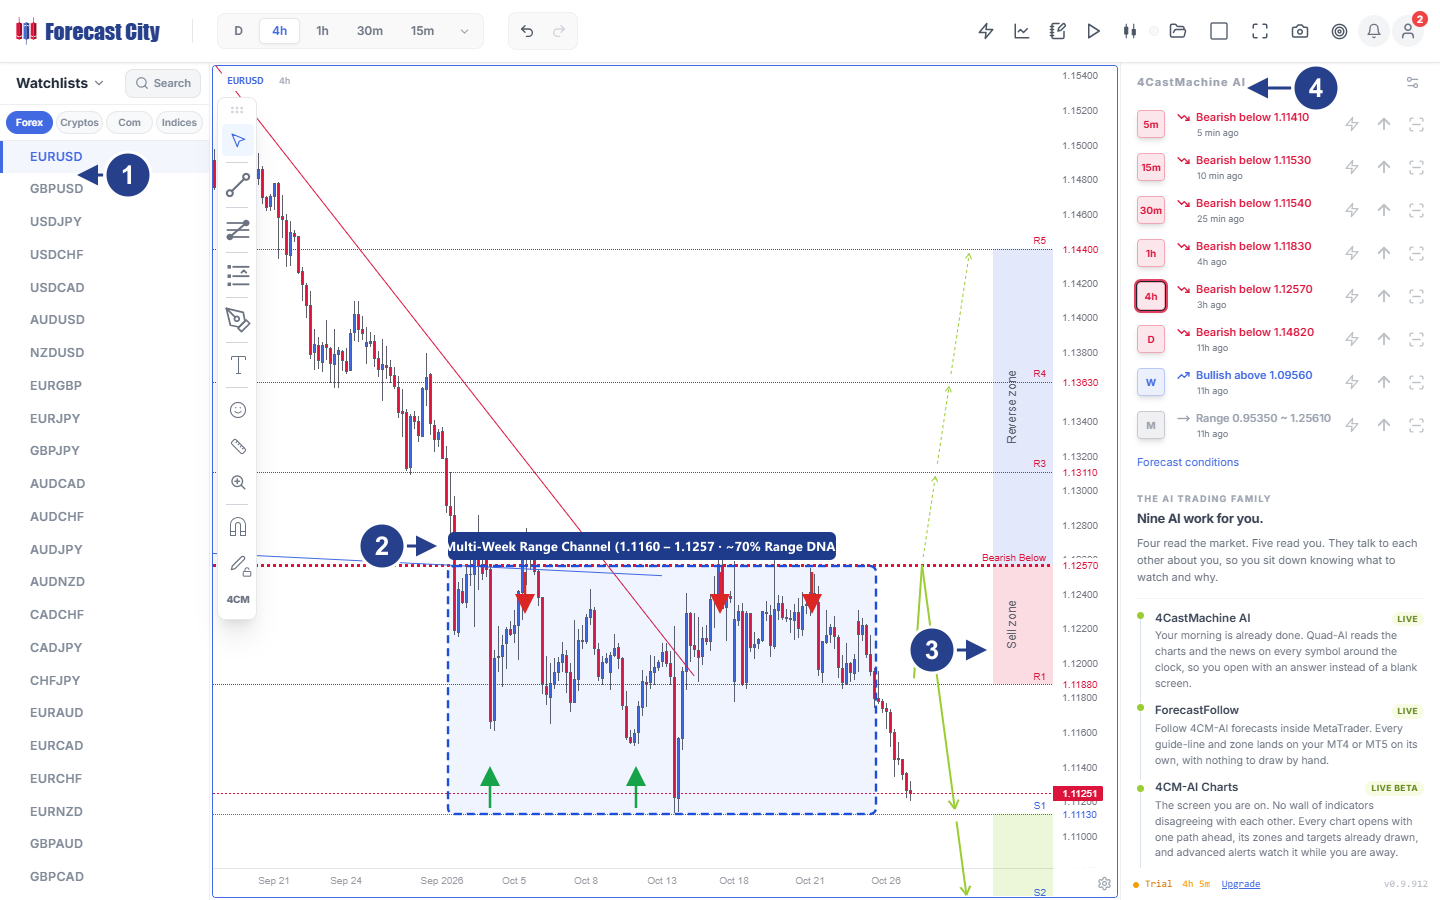
- Forex Watchlist: Open the Forex tab in the left Watchlist and select
EURUSDto load the live chart and forecast. - Multi-week range channel: Price bounces repeatedly between the
1.1160floor and the1.1257ceiling over three weeks, showing the classic range DNA of major pairs. - Sell zone and Reverse zone: 4CastMachine AI shades the red Sell zone (
1.1188to1.1257) and sets the Bearish Below invalidation pivot at1.1257. Yellow-green arrows map the expected drop towardS1(1.1113) andS2. - 4CastMachine AI multi-timeframe panel: The right panel shows every timeframe from
5mtoDaligned bearish below1.1257, while the M timeframe confirms a broader range.
How stock indices move
Instead of picking one single company stock that might suffer a bad quarter, a stock index lets you trade a basket of the strongest public companies in an economy. On your platform, US100 (NAS100 or Nasdaq 100) tracks the 100 largest non-financial tech and growth companies in the United States. Similarly, US500 (`S&P 500`) tracks 500 large US corporations, and GER40 (`DAX`) tracks 40 leading German companies.
Think of a stock index like a national sports team that only keeps top-performing players on the field. Unlike a currency pair, where two central banks pull back and forth around a flat average, a stock index has a built-in long-term upward bias for three structural reasons:
- Automatic index rebalancing: Whenever a company's business shrinks or falls behind, the index committee removes it and replaces it with a growing, profitable company through stock index rebalancing.
- Heavyweight tech leaders: Indices like US100 and
US500weight companies by total market value. Because the largest US tech giants (the Magnificent 7) make up over30%to40%of the index, strong earnings in those leaders lift the entire index. - Monthly retirement inflows: Millions of employees, pension funds, and retirement accounts automatically buy stock index funds every month, creating steady buying demand whenever prices dip.
Because of this structural demand, stock indices climb like a staircase and drop like an elevator. During uptrends, price advances in steady steps of Higher Highs and Higher Lows, whereas scary news headlines cause fast, sharp pullbacks that institutional buyers quickly buy back up. Waiting to buy a pullback inside the Buy zone is far safer than trying to short a rising index.
Stock indices also follow a strict daily clock. Even though index futures trade 23 hours a day, over 70% of the real daily volume in US100 and US500 erupts at the 09:30 EST Wall Street cash equity open (and at 08:00 GMT when Frankfurt opens for GER40). Before that opening bell rings, index charts often move slowly inside a narrow pre-market range.
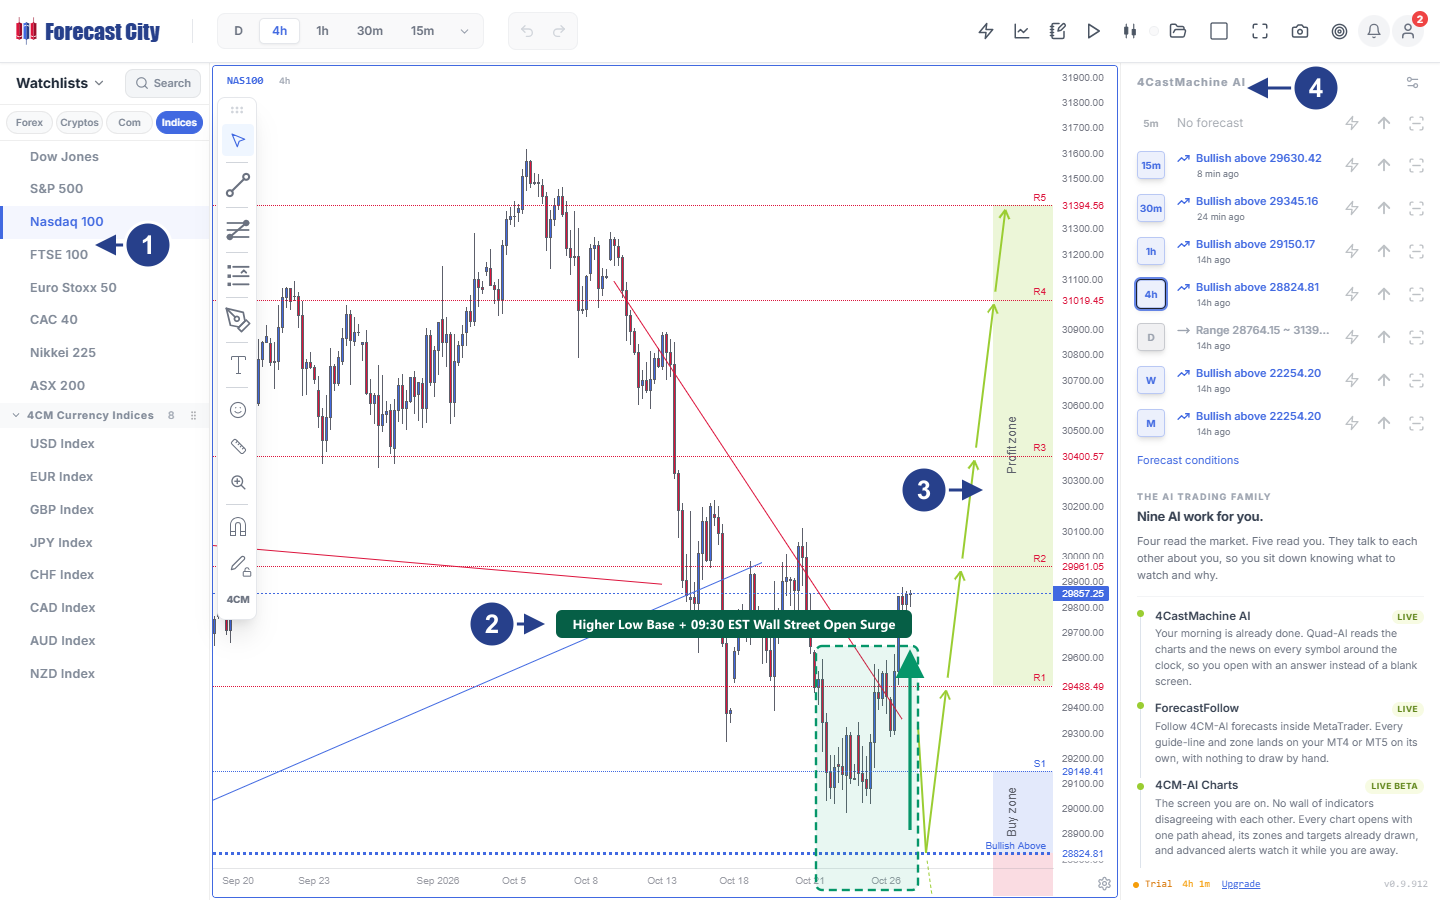
- Indices Watchlist: Open the Indices tab on the left and click
Nasdaq 100to load theNAS100chart. - Higher low base and 09:30 EST surge: Price pulls back to the
29000support floor and forms a clean Higher Low above the previous floor. Institutional buying at the09:30 ESTWall Street open then drives a700-point breakout candle above the red trendline. - Buy zone and Profit zone: 4CastMachine AI defines the Buy zone between
28824.81andS1(29149.41) and plots five upside targets fromR1(29488.49) toR5(31394.56). - Multi-timeframe bullish alignment: The 4CastMachine AI panel confirms bullish alignment across
15m,30m,1h,4h,W, andMat a glance.
How commodities move
Commodities are physical raw materials extracted from the earth, led in daily trading by precious metals: Spot Gold (XAUUSD) and Silver (XAGUSD): and energy contracts (WTI and Brent crude oil). Because central banks cannot print physical gold bars or oil barrels overnight, commodities move in powerful, multi-week trend waves when global inflation, bond yields, or physical supply shift.
To understand why Gold moves, remember one simple fact: a bar of gold sitting in a vault pays 0% interest. Big investment funds therefore compare Gold every day against US real bond yields (TIPS), which measure the interest rate on 10-year US Treasury bonds minus inflation:
- When real bond yields rise: Suppose 10-year US Treasury bonds pay
4.5%interest while inflation is only2.5%. Large funds earn a safe+2.0%real return above inflation by holding bonds, so money rotates out of Gold and weighs on XAUUSD. - When real bond yields fall or turn negative: If the Federal Reserve cuts interest rates or inflation rises so bond returns fall behind inflation, bonds lose purchasing power. Institutional capital and central banks then rush into XAUUSD and Silver, driving long bullish waves.
- US Dollar Index (DXY) and geopolitics: Because Gold and Oil are priced in US Dollars worldwide, a falling US Dollar Index (
DXY) makes Gold cheaper for buyers outside the US and lifts XAUUSD. Wars or banking stress also trigger immediate safe-haven buying in Gold. - Crude Oil (WTI and Brent) supply drivers: Crude oil reacts to global factory and travel demand, production quotas set by OPEC+ meetings, and the weekly US
EIAcrude oil inventory report released every Wednesday at10:30 EST.
Gold also has a famous intraday habit that traps unprepared traders between 08:00 and 08:30 EST. When New York metals trading opens on COMEX at 08:20 EST and US economic releases hit at 08:30 EST, thousands of retail traders have tight $2 or $3 stop-loss orders sitting just below obvious numbers inside the Buy zone.
Before launching the real trend wave, institutional desks often let price dip for a few minutes in a round-number stop sweep to fill their large buy orders against those retail stops. To survive these wicks, never use a tiny scalping stop on Gold; either trade on the daily (D) chart with a Soft Stop Loss or place an ATR volatility buffer behind the invalidation pivot.
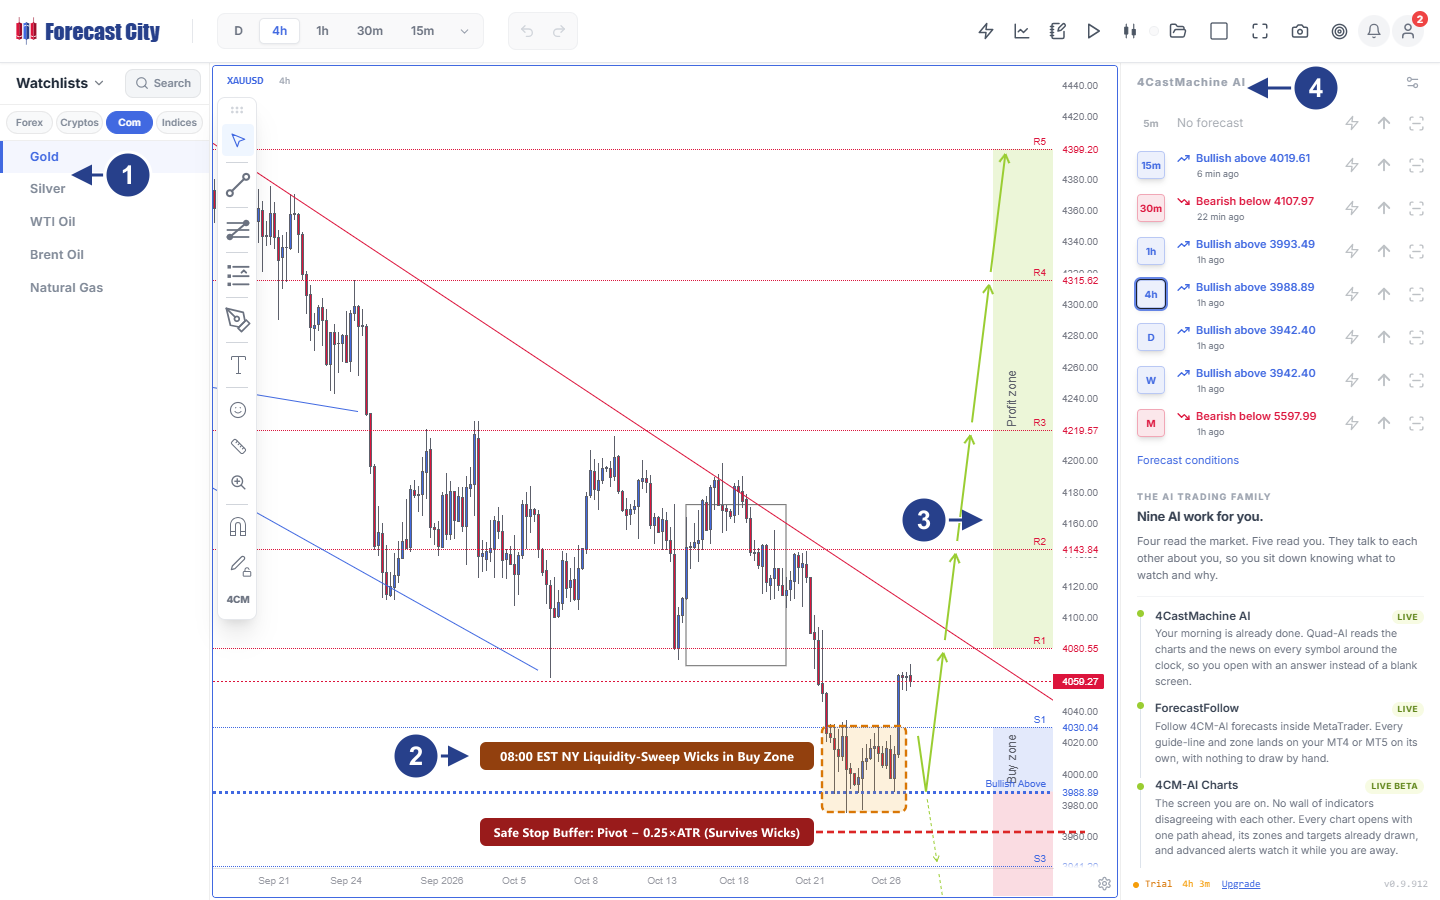
- Commodities Watchlist: Open the Com tab in the left Watchlist and select
Gold (XAUUSD). - Liquidity-sweep wicks in the Buy zone: Multiple
4hcandles poke long lower wicks into the3988.89to4030.04Buy zone. Those wicks sweep tight retail stops while staying safely above theATRbuffer line below the pivot. - Buy zone and Profit zone targets: Once the stop hunt finishes and buyers absorb the supply, price rallies cleanly from the Buy zone toward
R1(4080.55) andR2(4143.84). - Higher-timeframe alignment: The right panel shows
1h,4h,D, andWall aligned bullish above3988.89and3942.40, confirming that the lower wicks are buying dips in a strong uptrend.
How crypto moves
Cryptocurrencies led by BTCUSD (Bitcoin) and ETHUSD (Ethereum) are the only financial market in the world that never closes. Crypto trades 24 hours a day, 7 days a week, 365 days a year. Because there is no closing bell and short-term traders use heavy borrowed leverage, Crypto moves in distinct cycles: days of tight sideways compression followed by sudden, vertical breakouts.
Three practical mechanics explain why Crypto charts coil and explode the way they do:
- Bitcoin leads the entire market: Institutional money and spot ETF inflows enter BTCUSD first, setting the trend for the whole sector through Bitcoin dominance and altcoin rotation. Major altcoins like
ETHUSDandSOLUSDnormally follow Bitcoin's direction with wider percentage swings. - Perpetual leverage and liquidation cascades: While Bitcoin moves sideways inside a narrow box for several days, impatient traders pile into
10xto50xleveraged bets on both sides. When price finally breaks the box, exchanges force-close the losing trades in a perpetual futures liquidation cascade, fueling huge vertical candles. - Weekend coils vs. weekday US volume: On Saturday and Sunday, traditional banks and US spot ETFs are closed, so thinner volume often traps price in a tight range. The strongest, cleanest breakouts happen from Monday to Friday during US trading hours (
13:00to20:00 GMT).
The biggest mistake in Crypto is opening and closing trades inside the middle of a noisy consolidation coil. Wait patiently for price to reach the Buy zone or break out of the compression box with a healthy candle before you enter.
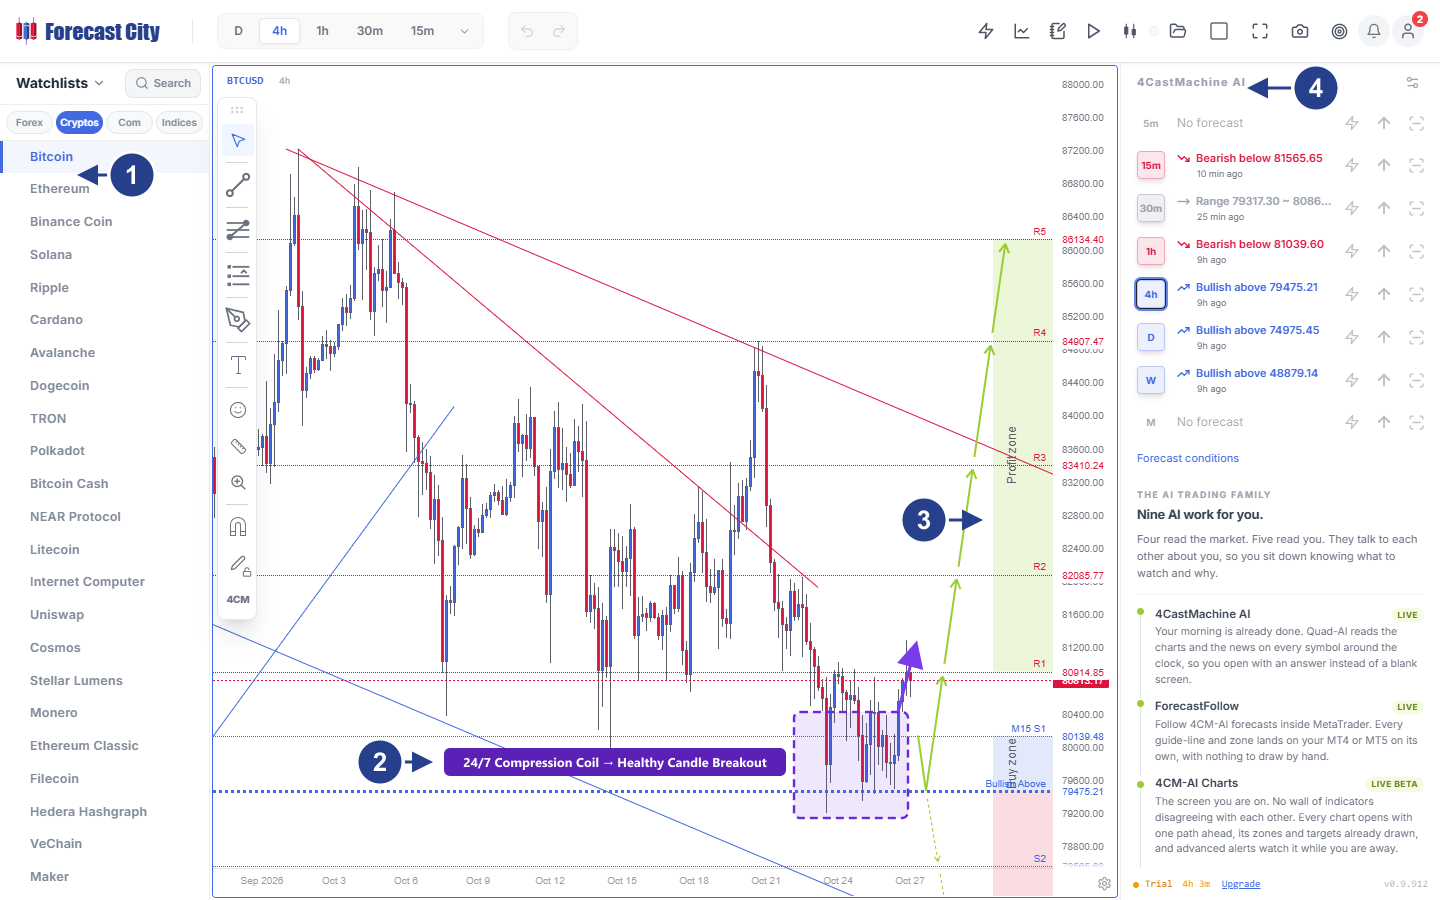
- Cryptos Watchlist: Click the Cryptos tab on the left and select
Bitcoin (BTCUSD). - 24/7 compression coil and healthy breakout: Price coils for several days between
79475.21and80400, shaking out impatient leveraged traders before breaking upward with a healthy candle. - Buy zone and Profit zone path: 4CastMachine AI anchors the Buy zone at
79475.21to80139.48and maps upside targets fromR1(80914.85) toR5(86134.40). - Multi-timeframe trend check: The 4CastMachine AI panel shows
4h,D, andWaligned bullish above79475.21while30mbreaks out of its range.
Compare the four markets at a glance
Keep this reference table handy before you switch from one asset class to another. It summarizes what you are trading, how price behaves, when real volume arrives, and how much each market moves on a normal day.
| Feature | Forex (Majors) | Indices (US & EU) | Commodities (Gold & Oil) | Crypto (BTC & ETH) |
|---|---|---|---|---|
| Benchmark symbols | EURUSD, GBPUSD, USDJPY |
US100 (NAS100), US500, GER40 |
XAUUSD (Gold), XAGUSD, WTI |
BTCUSD, ETHUSD, SOLUSD |
| What you are trading | Exchange rate between two national currencies | Basket of top public companies in an economy | Physical precious metals and crude oil barrels | Decentralized digital networks traded 24/7 |
| Dominant behavior | 70% range and channel oscillation |
Structural bullish trend with fast panic dips | Macro trend waves with deep stop-hunt wicks | Multi-day compression coils then vertical breakouts |
| Trading hours | 24/5 (Mon 00:00 to Fri 22:00 GMT) |
23/5 futures with peak cash session hours |
23/5 (1-hour daily settlement break) |
24/7/365 (non-stop including weekends) |
| Peak volume clock | London open (08:00 GMT) & NY overlap (13:00 GMT) |
09:30 EST Wall Street open & 08:00 GMT Frankfurt |
08:00 to 11:00 EST NY open & US macro news |
13:00 to 20:00 GMT (US equity & ETF hours) |
| Typical daily range (ATR) | 65 to 80 pips/day (~0.6% on EURUSD) |
280 to 380 pts/day (~1.5% on US100) |
$35 to $55/day (~1.6% on XAUUSD) |
$2500 to $4500/day (3% to 5%+ on BTCUSD) |
| Best trading setup | Fading Buy/Sell zone edges in ranges | Buying Higher Low pullbacks at Buy zone | Trend continuation with ATR stop buffer |
Breakout with a healthy candle after coil |
Why one fixed stop loss and lot size fails
Now let us solve the single biggest math mistake that wipes out multi-asset traders. Beginners often fall in love with one fixed trade size, such as 0.10 lot, and one fixed stop habit, such as 20 pips, and use them on every chart.
Why does that habit destroy accounts? Because every market has a completely different daily Average True Range (ATR): the average distance price travels from low to high in a normal day: and a different dollar value per pip and lot size.
Let us compare what happens on a $10000 account when you want to risk exactly 1% ($100) per trade across three different markets:
- On Forex (EURUSD): A normal day moves about
70pips (~0.6%), and a technical stop behind the 4CastMachine AI pivot needs25pips of room. Since0.10lot onEURUSDequals$1per pip, trading0.40lot ($4per pip ×25pips) risks exactly$100. - On Gold (XAUUSD): Gold swings
$35to$55per ounce on a normal day. If you place a tiny$2stop loss on Gold, ordinary market noise stops you out in seconds; a safe stop behind the Buy zone pivot needs about$20of room. Because0.01lot of Gold equals$1per dollar move, you scale your size down to0.05lot ($5per dollar ×$20stop =$100risk). - On Bitcoin (BTCUSD): Bitcoin routinely swings
$2500to$4500per day, so a safe technical stop behind the Buy zone often needs$2000of breathing room. By adjusting your position size to0.05lot (where a$2000move equals$100), a massive$2000Bitcoin swing risks the exact same$100as your quiet25-pip Euro trade.
Professional traders never keep their lot size fixed; they keep their dollar risk fixed (such as $100 per trade) using two simple steps:
- Step 1: Set the stop from the chart's own volatility: Place your stop loss behind the 4CastMachine AI invalidation pivot plus a buffer scaled to that symbol's daily
ATR. - Step 2: Calculate the lot size from the stop distance: Divide your fixed
$100risk by the stop distance so every trade risks1%, regardless of whether the stop is25pips onEURUSDor$20on Gold.
Inside ForecastCity, you never have to do this arithmetic by hand. 4CastMachine AI and AI Strategy Studio measure each market's ATR(264, D) volatility and calculate your exact position size automatically in seconds.
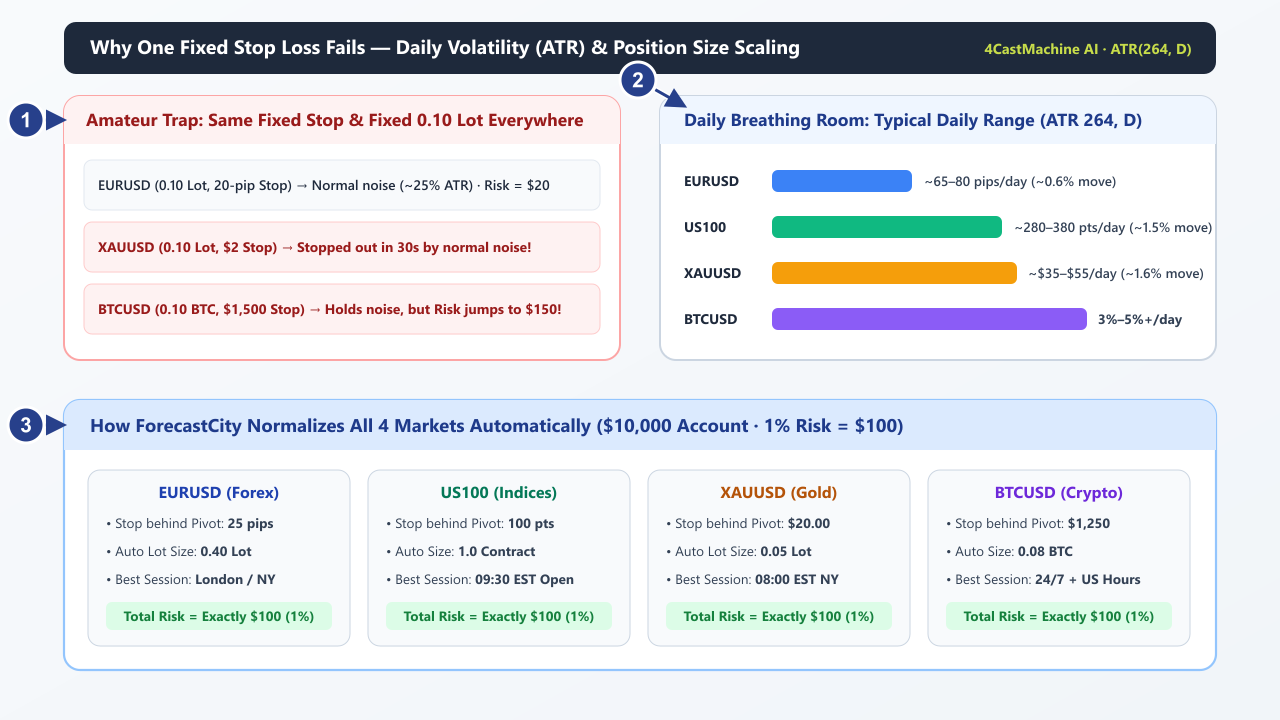
- Amateur fixed-stop trap: Using the same tight stop and
0.10lot everywhere gets stopped out by normal wicks on Gold or multiplies your dollar loss on Bitcoin. - Daily breathing room (ATR 264, D): Daily volatility expands from
~0.6%on EURUSD to~1.5%onUS100,~1.6%onXAUUSD, and3%to5%+onBTCUSD. - Automatic risk normalization: By scaling lot size to each market's stop distance behind the pivot, every trade on a
$10000account risks the exact same$100(1%).
Choose your primary market
You do not need to watch twenty charts at once to build a profitable trading career. Start by choosing one primary market and one secondary market that fit the hours you are naturally awake and free:
- Morning schedule (08:00 to 12:00 GMT): Focus on EURUSD,
GBPUSD, andGER40during the European and London morning session. - Afternoon schedule (13:00 to 17:00 GMT / 08:00 to 12:00 EST): Focus on XAUUSD around the
08:20 ESTNew York metals open andUS100orUS500at the09:30 ESTWall Street bell. - Busy daytime schedule or weekend review: Trade the daily (
D) and4hcharts across Forex, Gold, or BTCUSD using stepped profit targets and a Free Trade, and let Tell me when alerts notify you when price reaches a zone.