
Every 4CastMachine AI forecast is drawn with the same visual language across all eight timeframes (5m, 15m, 30m, 1h, 4h, D, W, and M). Once you learn what each arrow, shaded zone, pivot line, and technical line means on one chart, you can read all 125 symbols in seconds.
Visual rule of thumb: On the chart canvas, green arrows always mark your active trading path (whether the forecast is Bullish or Bearish), and the opposite side of the pivot holds the Reverse zone and dashed alternate arrows. In the 4CastMachine AI side panel, blue/green icons mean Bullish (up), red icons mean Bearish (down), and grey arrows mean Range.
What do solid and dashed green arrows mean?
When you open a symbol with an active forecast on 4CM-AI Charts, you see two types of green arrows on the candles:
Solid green arrows (main path): Show the primary main path of the forecast. They start inside the Buy zone (or Sell zone) and point step by step toward the Profit zone targets. As long as price stays on the forecast side of the pivot, you trade in the direction of the solid green arrows.
Dashed green arrows (alternate path): Drawn on
4hand lower timeframes starting from the Reverse zone on the other side of the pivot. They show the alternate path if price breaks the pivot and holds inside the Reverse zone.
Compare the full-width EURUSD 4h bullish forecast below with the BTCUSD 15m bearish forecast in the next section to see how every zone and line adapts to the market direction:
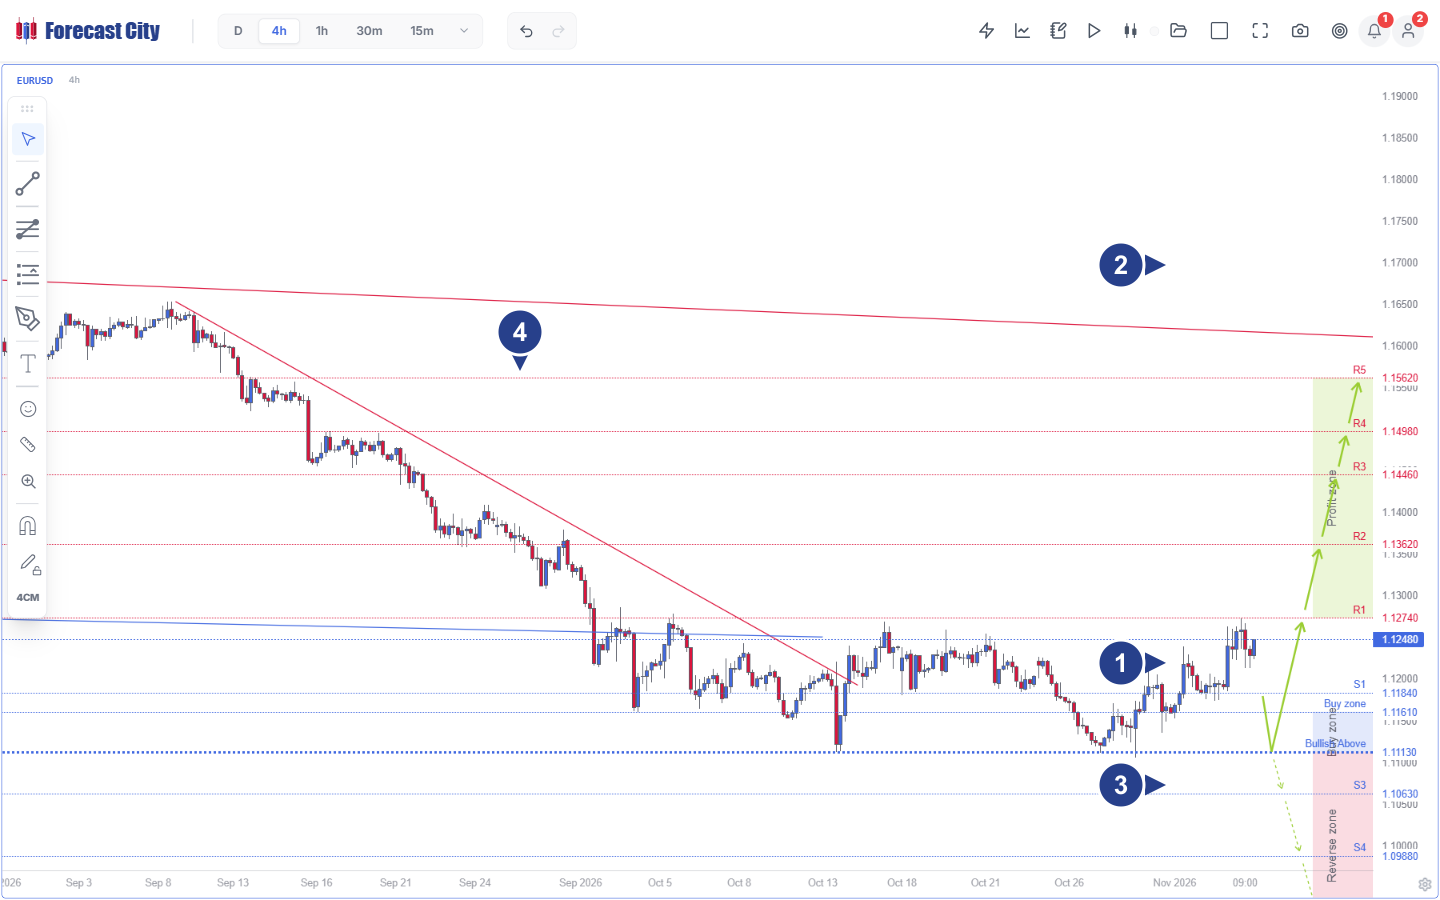
Buy zone (1.11130 to 1.11610) and Pivot: price reversed inside the
1.11130–1.11610support band above theBullish Above 1.11130pivot, reclaimedS1 = 1.11840, and now trades at1.12480.Solid green arrows and Profit zone (R1 1.12740 to R5): the bullish main path targets
R1 = 1.12740,R2 = 1.13620,R3 = 1.14460,R4 = 1.14980, andR5 = 1.15620.Reverse zone below 1.11130 and dashed arrows: if price breaks below
1.11130, the dashed alternate path targetsS3 = 1.10630andS4 = 1.09880.Historical swings and AI trend lines: red resistance trend lines show the broken downtrend channel and the upper macro boundary above
R5.
How do the Pivot and the four shaded zones work?
Instead of a single thin line, 4CastMachine AI draws shaded price bands that match how institutional orders are stacked in the market:
| Chart element | Where it sits on the chart | How you use it in a trade |
|---|---|---|
| Pivot | The exact boundary line where the Buy zone (bottom edge, such as 1.11130 on EURUSD 4h) or Sell zone (top edge, such as 81461.93 on BTCUSD 15m) begins. |
Defines forecast validity (Bullish above X or Bearish below Y). Your intraday stop loss goes behind this line by 10% of ATR(264, D) + spread. |
| Buy zone | Shaded support band above a bullish pivot (such as 1.11130–1.11610 on EURUSD 4h). |
Look for a bullish reversal candle (Hammer or Bullish Engulfing on intraday; Hammer or Valley on D) inside this band to open a Buy trade. |
| Sell zone | Shaded resistance band below a bearish pivot (such as 80894.67–81461.93 on BTCUSD 15m). |
Look for a bearish reversal candle (Shooting Star or Bearish Engulfing on intraday; Shooting Star or Peak on D) inside this band to open a Sell trade. |
| Profit zone | Green shaded target band at the end of the solid green arrows (R1–R5 in a Buy setup; S1–S5 in a Sell setup). |
Contains the stepped take-profit levels (TP1 to TP5 on intraday) where you lock in gains. |
| Reverse zone | Shaded band on the opposite side of the pivot (drawn on 4h and lower timeframes). |
Marks where the main forecast is invalidated and the dashed alternate path takes over toward the opposite targets. |
To keep your chart stable while you plan a trade, the outer boundary of an active Buy zone or Sell zone stays locked in place for as long as the forecast keeps the same direction and pivot price.
How do I read the 8-row 4CastMachine AI panel?
To the right of the chart canvas sits the 4CastMachine AI panel (press Shift+4 to show or hide it). It lists all eight forecast timeframes from 5m down to M, as shown on this BTCUSD 15m bearish setup:
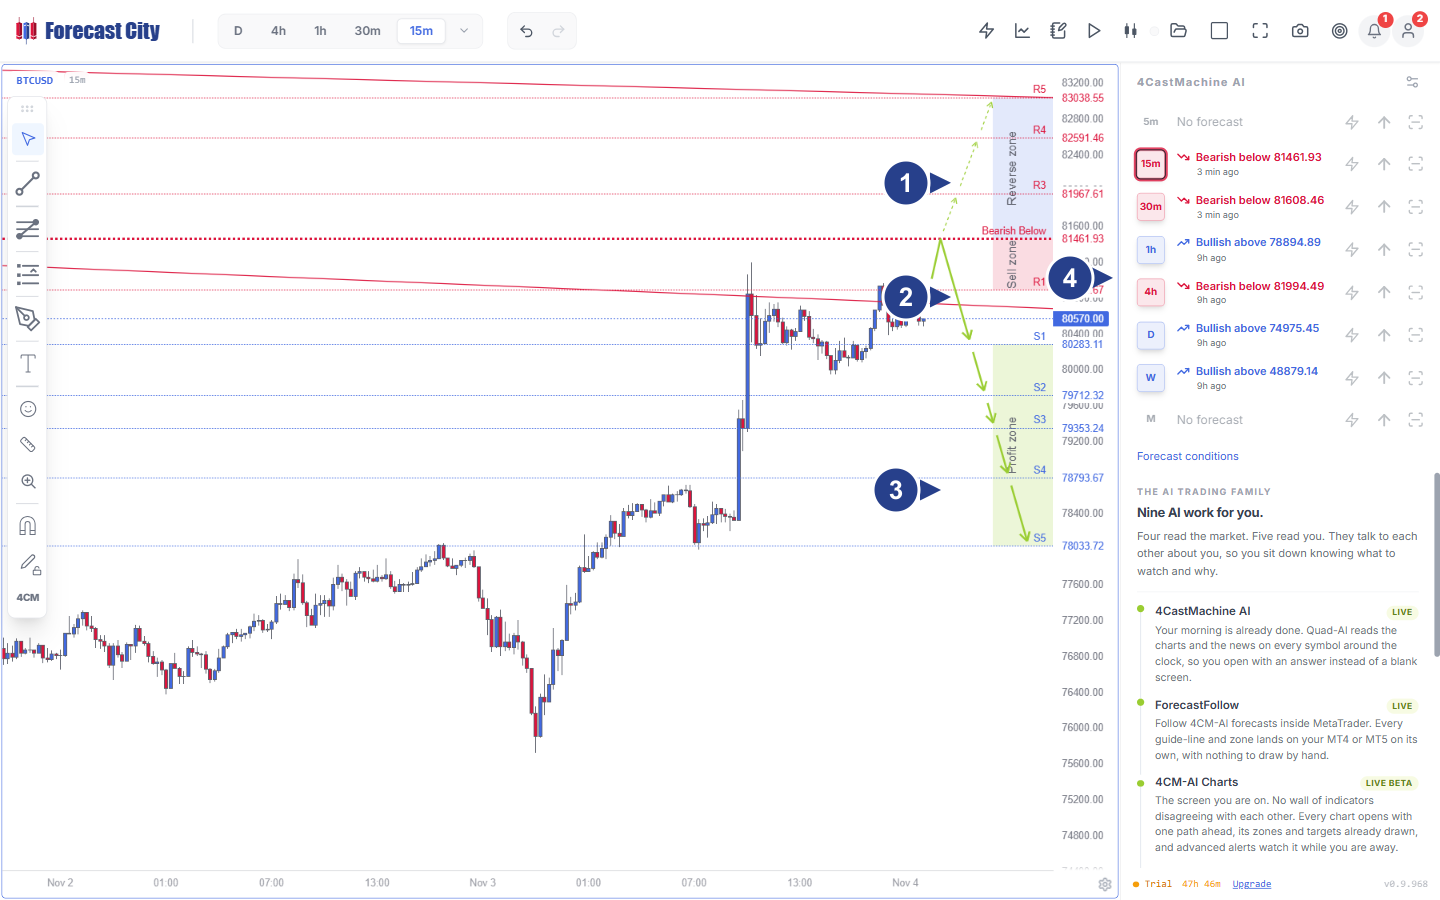
Bearish Below 81461.93 pivot and Reverse zone (R3 to R5): if
BTCUSDbreaks above81461.93, dashed arrows point up toR3 = 81967.61,R4 = 82591.46, andR5 = 83038.55.Sell zone (R1 80894.67 to 81461.93): price tested the
Sell zoneand the red AI trend line, rejected downward, and now trades at80570.00.Main path and Profit zone (S1 80283.11 to S5 78033.72): solid green arrows point down to
S1 = 80283.11,S2 = 79712.32,S3 = 79353.24,S4 = 78793.67, andS5 = 78033.72.4CastMachine AI multi-timeframe panel: the ring around
15mshows that15m(Bearish below 81461.93) is drawn on the canvas; clicking any other row (such as1h Bullish above 78894.89or4h Bearish below 81994.49) overlays that timeframe's technical lines onto your chart, whileNo forecast(on5mandM) appears when a timeframe is between completed waves.
What are the technical lines (S1–S5, R1–R5, and trend lines)?
Alongside the shaded zones, 4CastMachine AI draws the key structural lines that define the wave:
Resistance lines (R1 to R5): Horizontal ceilings above price. In a bullish forecast (like
EURUSD 4habove),R1 = 1.12740toR5 = 1.15620align with your stepped take-profit targets. In a bearish forecast (likeBTCUSD 15mabove),R1 = 80894.67bounds the Sell zone andR3 = 81967.61toR5 = 83038.55bound the Reverse zone.Support lines (S1 to S5): Horizontal floors below price. In a bullish forecast (
EURUSD 4h),S1 = 1.11840sits just above the Buy zone andS3 = 1.10630toS4 = 1.09880mark the Reverse zone targets. In a bearish forecast (BTCUSD 15m),S1 = 80283.11toS5 = 78033.72align with your five stepped take-profit targets.AI trend lines and RSI divergence lines: Diagonal structural trend lines on price (red resistance and blue support) and divergence lines on the
RSIindicator that highlight momentum shifts.
How do I show or hide forecast layers in chart settings?
Double-click the chart background or click the gear icon at the bottom right to open Settings... on the first tab:
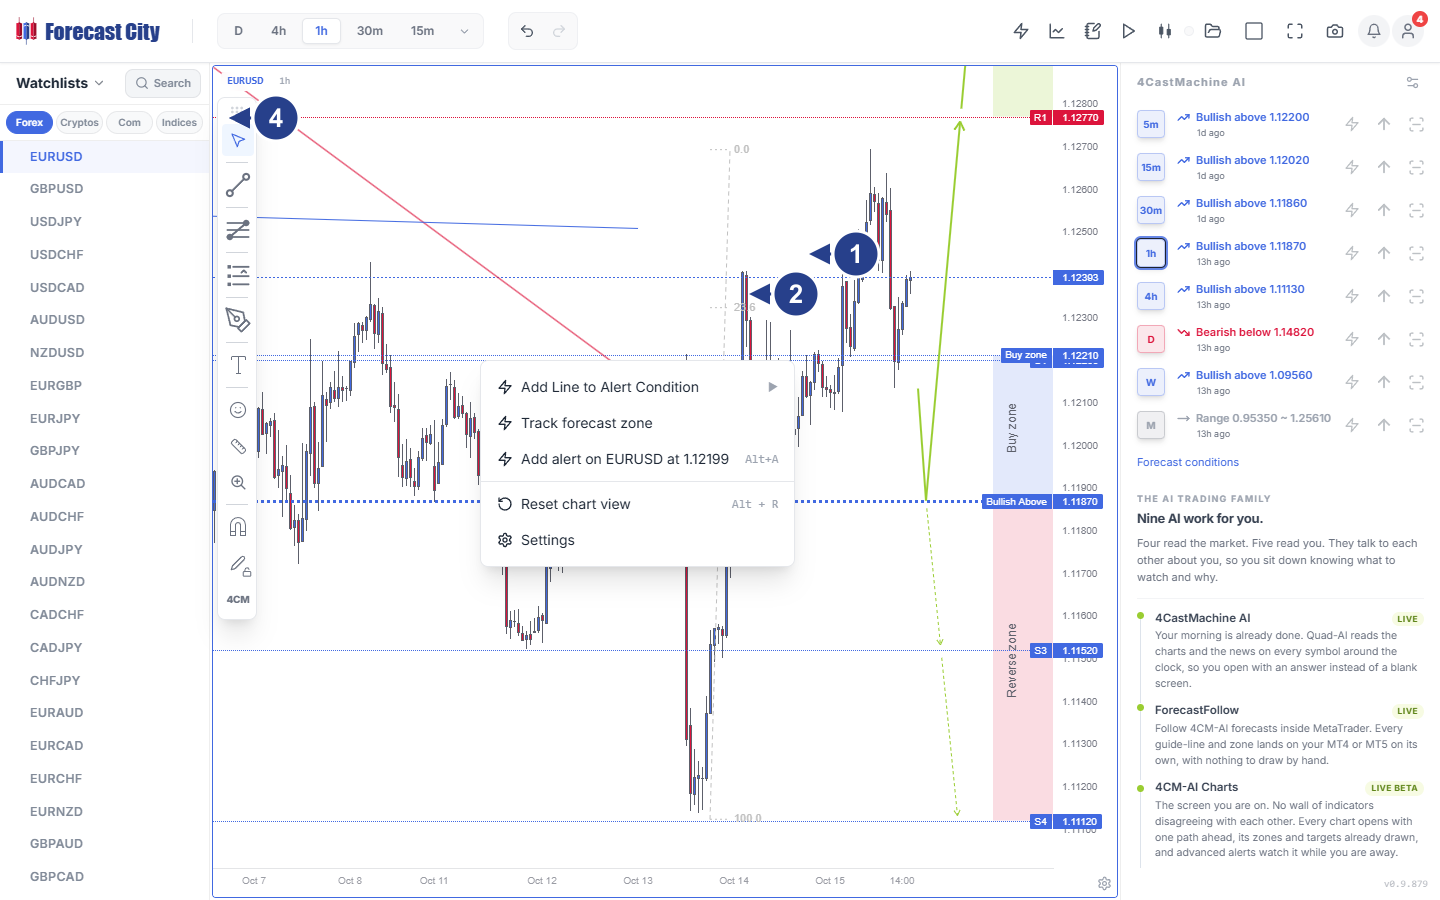
Show 4CastMachine AI Forecast: Master switch for all forecast zones, arrows, and lines on the active chart.
Show Details: Shows or hides the price tags and level labels (
S1,R1, zone boundary prices) on the canvas.Higher TF Support & Resistance and Higher TF Trend Lines: Overlays support, resistance, and trend lines from higher timeframes (labeled with their timeframe prefix, such as
D S1or4h R1).Show Trend Hunter History and Show Divergence and Technical Lines on RSI: Displays historical Trend Hunter Strategy guide-lines (
4U/4Don daily and higher charts) andRSIdivergence lines.
Where do I go next?
Now that you can read every element on the chart, open Lesson 3: Trade intraday forecasts (5m–4h): 4CM-AI strategy to learn the exact entry, target, stop-loss, and break-even rules for intraday trading.