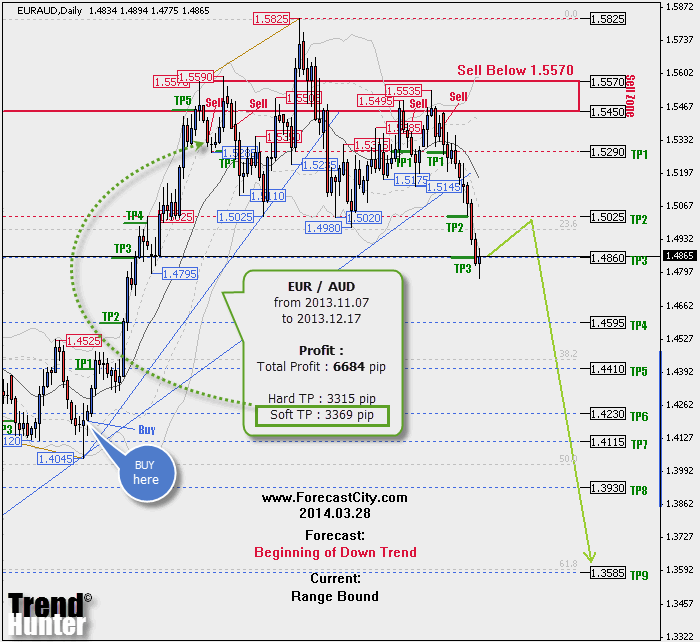
In this 5-minute quick tour, you walk through all five stages of a complete Trend Hunter Strategy trade on the daily (D) chart. With 4CastMachine AI updating the zones every Saturday and Daily Trading Opportunity (DTO) scanning for entry candles, you can follow the entire workflow in minutes each week.
What this quick tour covers: You start on Saturday by picking a chart with a fresh Buy zone or Sell zone, wait for a daily reversal candle, open stepped targets plus one Free Trade, move your stop to Break-Even, and close the runner when the trend ends.
Step 1 on Saturday: pick a chart with a Buy zone or Sell zone?
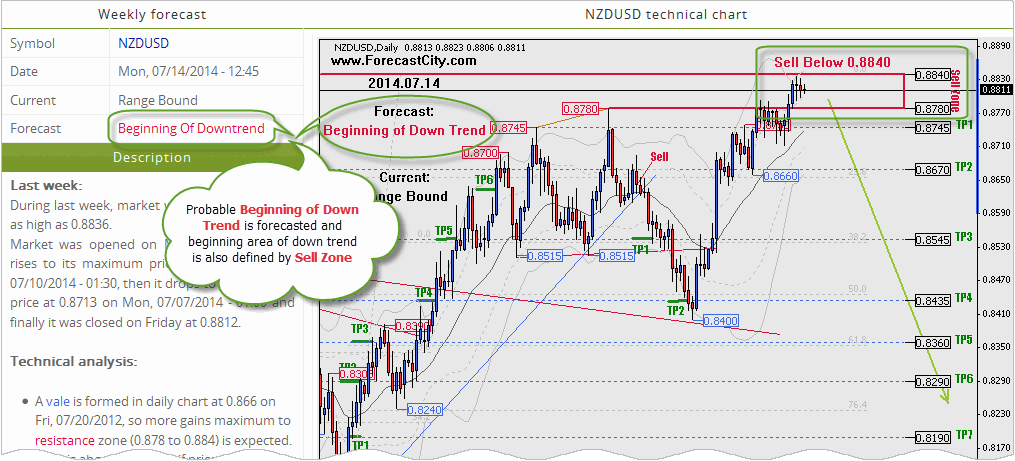
On Saturday, open Weekly Forecasts (or open any symbol on the daily
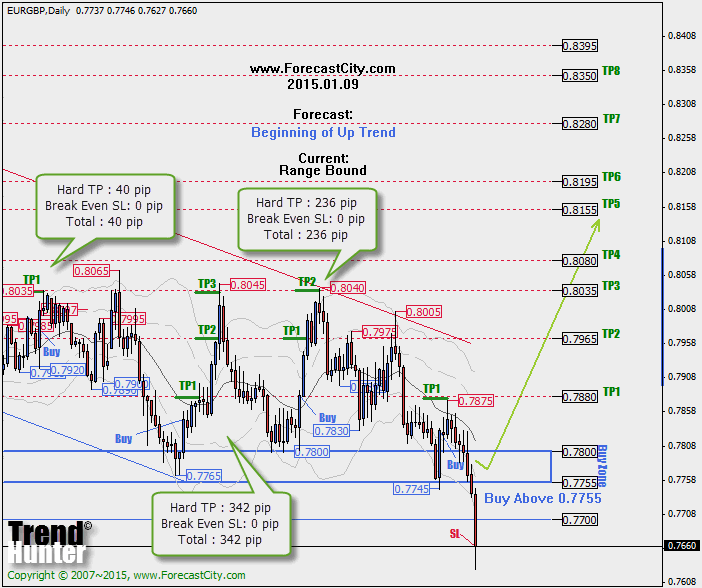
Dchart in 4CM-AI Charts) and look for symbols showingForecast: Beginning of Up TrendorForecast: Beginning of Down Trend.Note the shaded Buy zone (support where a new uptrend is likely to start) or Sell zone (resistance where a new downtrend is likely to start) on the chart and set an alert on it.
Step 2 at the zone: wait for a daily reversal pattern?
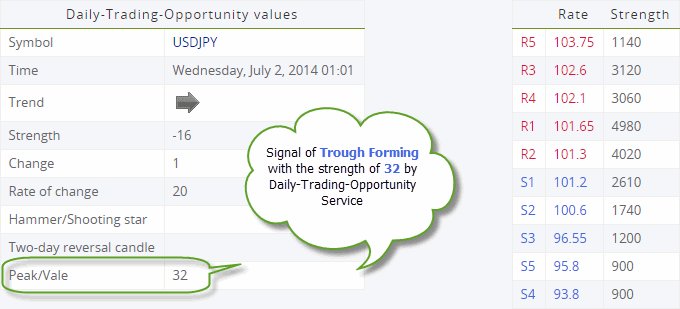
Do not open a trade just because price touches the zone. Wait for the daily (
D) candle to close and form a reversal pattern inside (or withinATR(264) / 2of) the zone.For a Buy zone, wait for a daily Hammer or Valley (Trough). For a Sell zone, wait for a daily Shooting Star or Peak. Check the pattern's strength score in the DTO table.
If the pattern forms on Friday, wait and enter when the market opens on Monday morning (as long as Monday opens without a price gap).
Step 3 on entry: split your setup into stepped targets and one Free Trade?
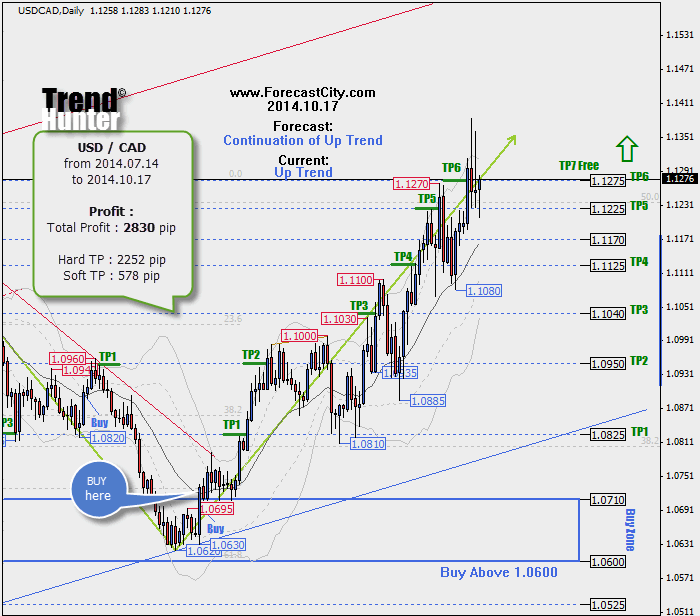
Divide your planned trade size across several equal orders at the same entry price (or configure multi-target exits in AI Strategy Studio).
Set fixed take-profit targets (
Hard Take Profit:TP1,TP2, ...) on the support or resistance levels mapped by the forecast.Leave one order open with no fixed take-profit target (the Free Trade /
Free Take Profit) to ride the wave if the trend breaks past the final target.
Step 4 after initial profit: move stops to Break-Even (or exit on a zone break)?
Once price hits
TP1,TP2, orTP3(or crosses the dailyWEMA-21line), move the stop loss of all remaining open orders to the entry price (Break-Even). From that moment on, a pullback cannot cause a loss.If price reverses before Break-Even and a full healthy daily candle closes outside the outer edge of the entry zone (with at least
80%of its body outside the zone), close the trades on a Soft Stop Loss.
Step 5 at trend end: close the Free Trade when the wave finishes?
Hold your untargeted Free Trade (and any remaining open targets) while the daily trend stays valid.
Close all remaining open orders by hand when a new weekly forecast announces a trend in the opposite direction, or when a full healthy daily candle breaks the horizontal green trend-end guide-line (with at least
80%of its body beyond the line).