In ForecastCity, Saturday's Weekly Forecasts map the exact price zone where a new daily trend is likely to start before the reversal happens. Instead of chasing a wave after it has already moved hundreds of pips, you prepare in advance to enter at the Buy zone or Sell zone.
Trend hunter vs. trend follower?
Most trend strategies rely on lagging indicators such as moving-average crossovers. Days or weeks pass, and price moves hundreds of pips away from the reversal point before those indicators confirm the new direction. Because they wait until the trend is obvious to everyone, they are called trend followers. By the time a trend follower enters, a large part of the wave is already over and the stop loss sits far away.
The core advantage of the Trend Hunter Strategy is that it identifies the start of a new trend in advance. Entering near the origin of the daily wave gives you the largest profit potential with the smallest initial risk.
How Weekly Forecasts map the start of a trend?
Every Saturday, 4CastMachine AI analyzes structural support and resistance across the monthly (M), weekly (W), and daily (D) timeframes and plots the result on the daily (D) chart:
Forecast direction: The forecast header and chart banner show
Forecast: Beginning of Up TrendorForecast: Beginning of Down Trend.Entry zone: A shaded Buy zone marks the support band where an uptrend is likely to begin (with the guide-line note
Buy above …). A shaded Sell zone marks the resistance band where a downtrend is likely to begin (with the noteSell below …).
Example on NZDUSD: hunting a new daily downtrend
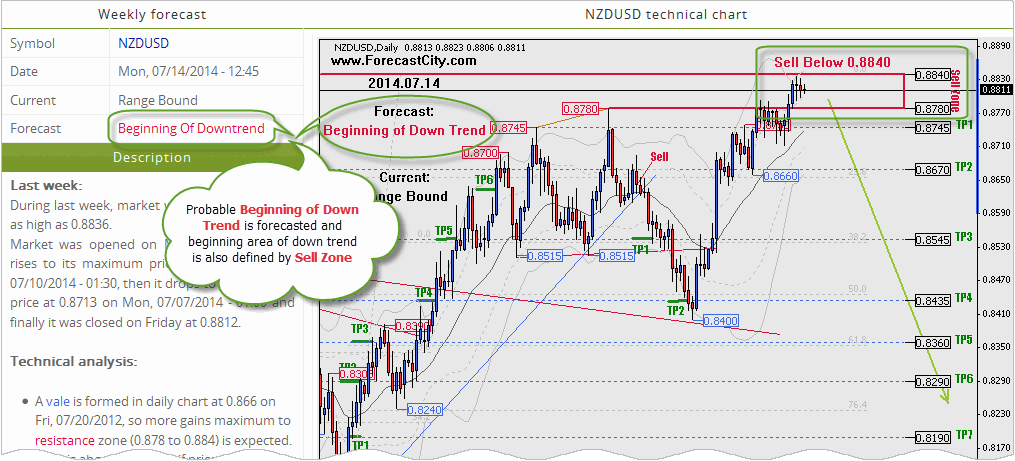
On 2014-07-14 (Figure 1), the weekly forecast for NZDUSD announced Forecast: Beginning of Down Trend. The Sell zone sat between 0.8780 and 0.8840, and the chart note Sell below 0.8840 showed where we planned to open Sell trades once a daily reversal pattern formed.
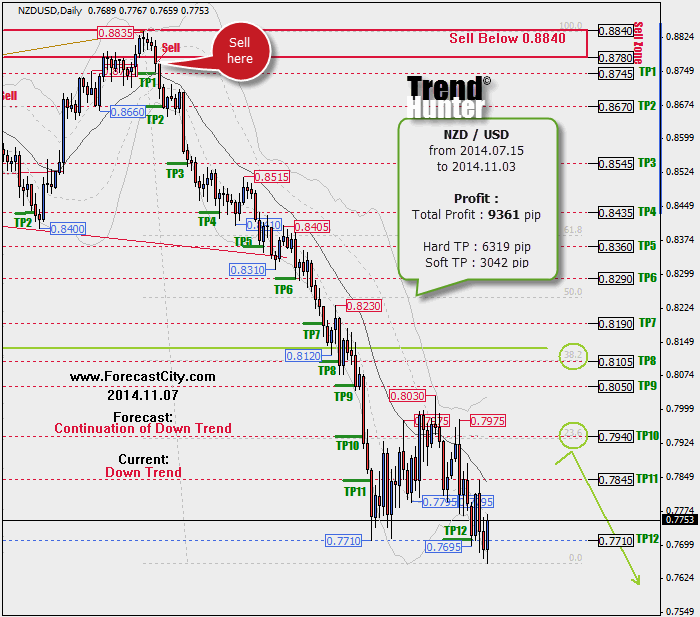
Sell trade result on NZDUSD (Figure 2): Price reversed down right from the Sell zone. Our stepped Sell orders banked 9361 pips in 79 trading days through 2014-11-03.
Example on USDCHF: hunting a new daily uptrend
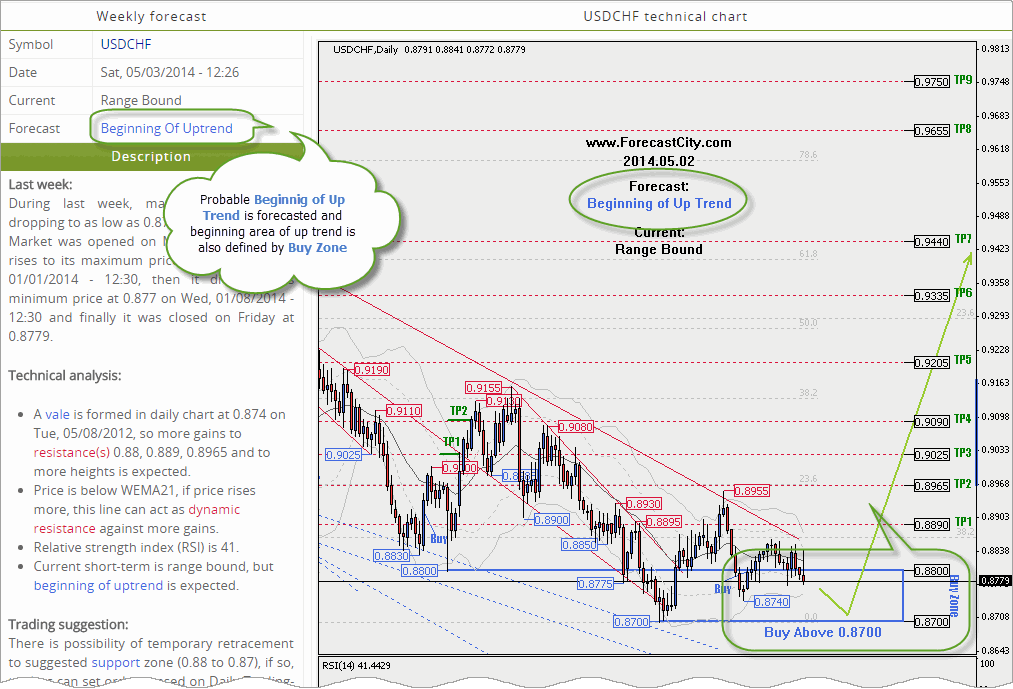
On 2014-05-03 (Figure 3), the weekly forecast for USDCHF announced Forecast: Beginning of Up Trend. The Buy zone sat between 0.8700 and 0.8800, with the note Buy above 0.8700 marking where we planned to open Buy trades.
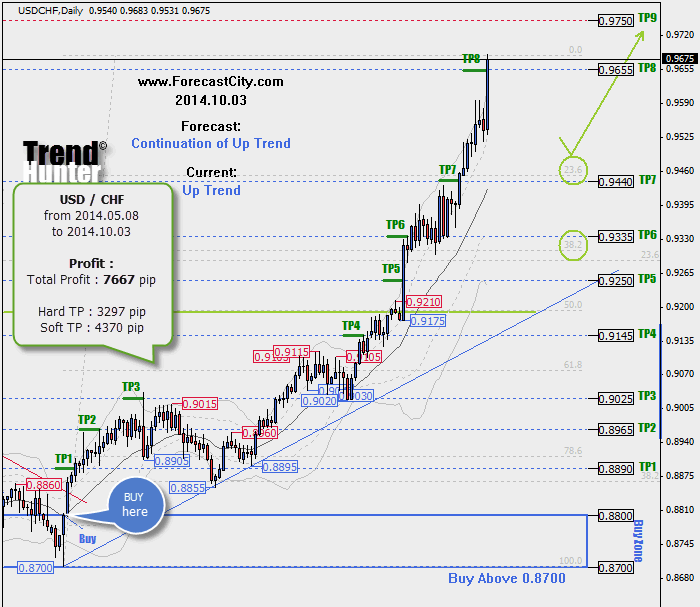
When price reversed up from that Buy zone (Figure 4), our stepped Buy orders earned 7667 pips across 106 trading days through 2014-10-03.