
In the Trend Hunter Strategy, reaching a Buy zone or Sell zone is only the first condition. You wait for a daily reversal pattern to confirm that buyers or sellers have stepped in, while Daily Trading Opportunity (DTO) scans every chart and scores pattern strength for you automatically.
Wait for a daily reversal pattern inside the zone?
Strict entry confirmation is a key reason why the Trend Hunter Strategy achieves a high win rate. When price touches a Buy zone or Sell zone, you never place a blind entry order.
Instead, you wait for the daily (D) candle to close and form one of four reversal patterns:
Candlestick reversal: A daily Hammer at a Buy zone, or a daily Shooting Star at a Sell zone.
Swing reversal: A daily Valley (Trough) at a Buy zone, or a daily Peak at a Sell zone.
Our Daily Trading Opportunity (DTO) scanner detects these patterns automatically at the daily close and calculates a pattern strength score. That score reflects the historical success rate of the pattern so you can size your position with confidence.
Intraday forecasts (1h and 4h) can also provide earlier entries inside a daily zone. However, because intraday timeframes carry more price noise, only experienced traders should use them for Trend Hunter Strategy entries.
Entry methods for Buy trades (USDJPY example)
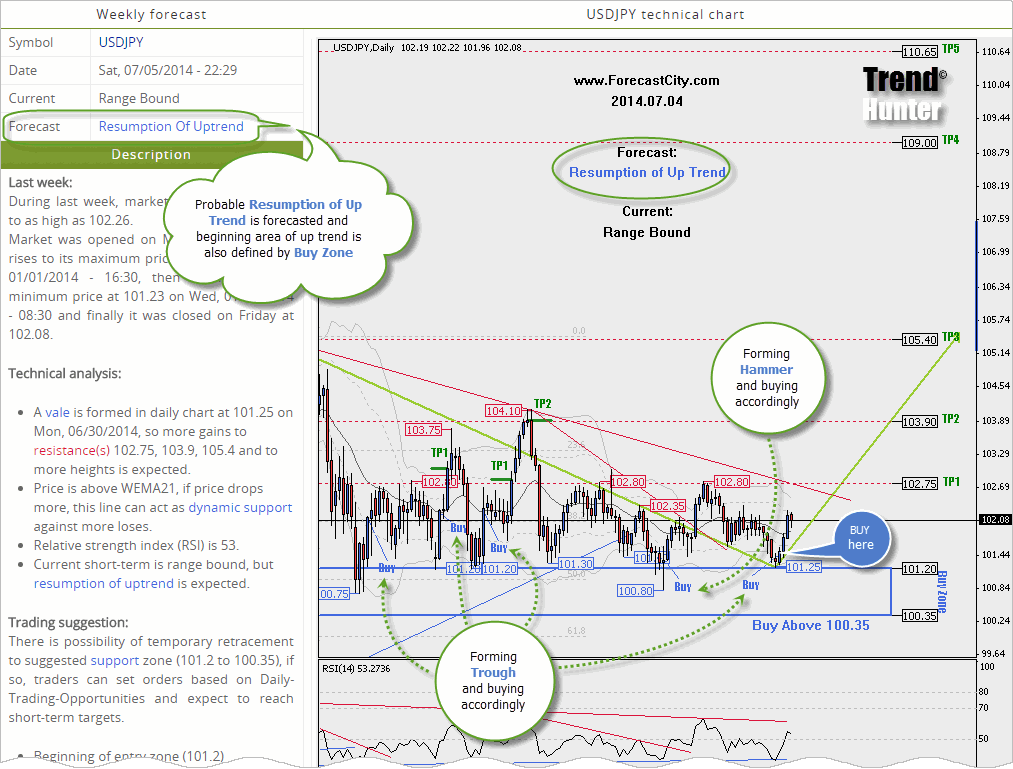
When price touches or enters the Buy zone and forms a daily Hammer or Valley, you open Buy trades.
In Figure 1 on USDJPY daily (up to 2014-07-05), the Buy zone held as support for months. Price formed four Valleys and one Hammer inside the zone, and earlier entries banked smaller gains of 100 to 200 pips before pulling back to Break-Even.
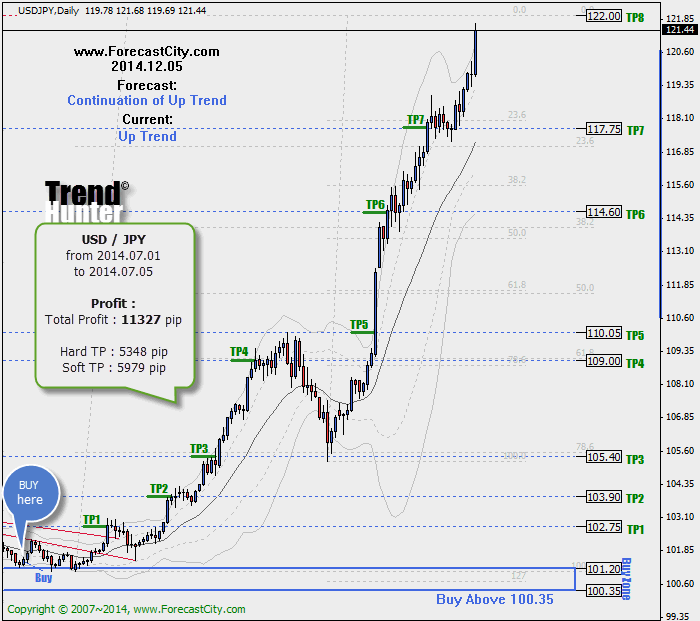
Buy entry result on USDJPY (Figure 2): On 2014-07-02, entering Buy trades on the final daily Valley inside the Buy zone caught the major uptrend and banked 11327 pips in 112 trading days.
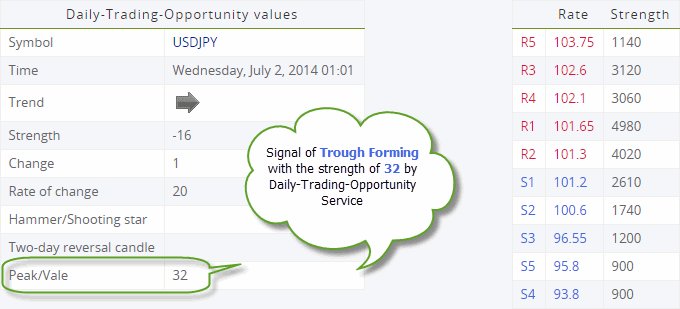
In Figure 3, you can see the automatic DTO scanner table from 2014-07-02, which reported that USDJPY daily Trough (Valley) with a pattern strength of +32.
Entry methods for Sell trades (EURUSD example)
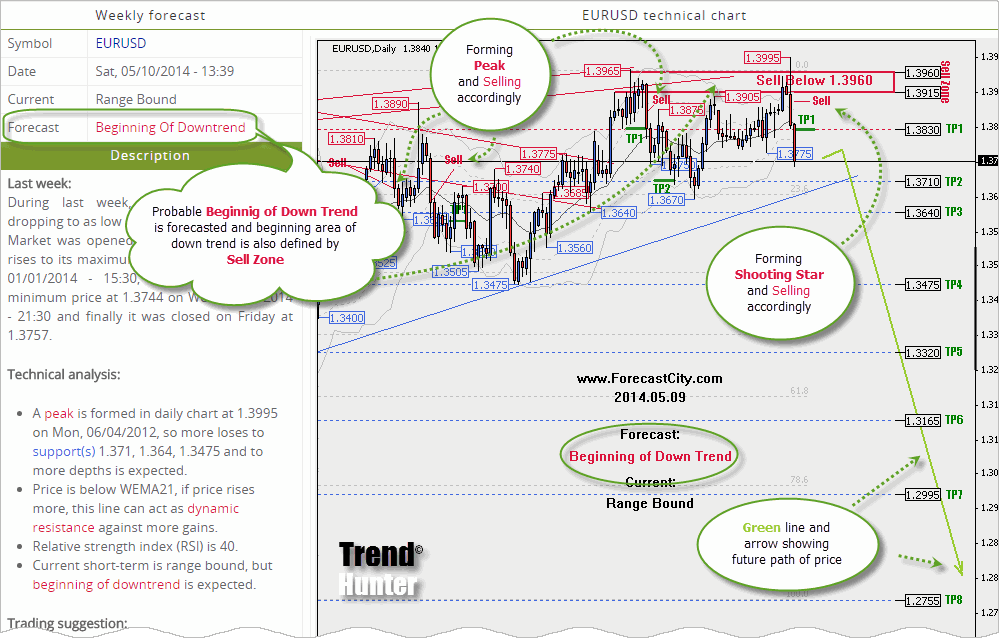
When price touches or enters the Sell zone and forms a daily Shooting Star or Peak, you open Sell trades.
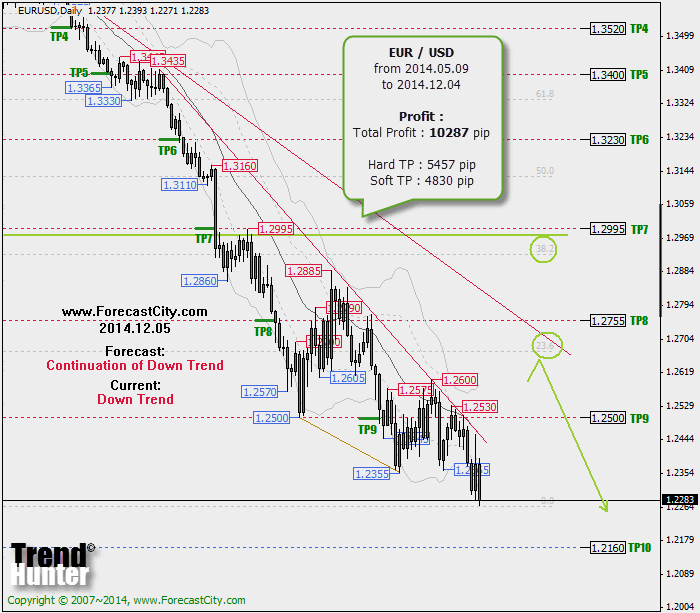
In Figure 4 on EURUSD daily, the Sell zone capped price for months across three Peaks and one Shooting Star. Earlier entries banked 100 to 200 pips before the main wave began.
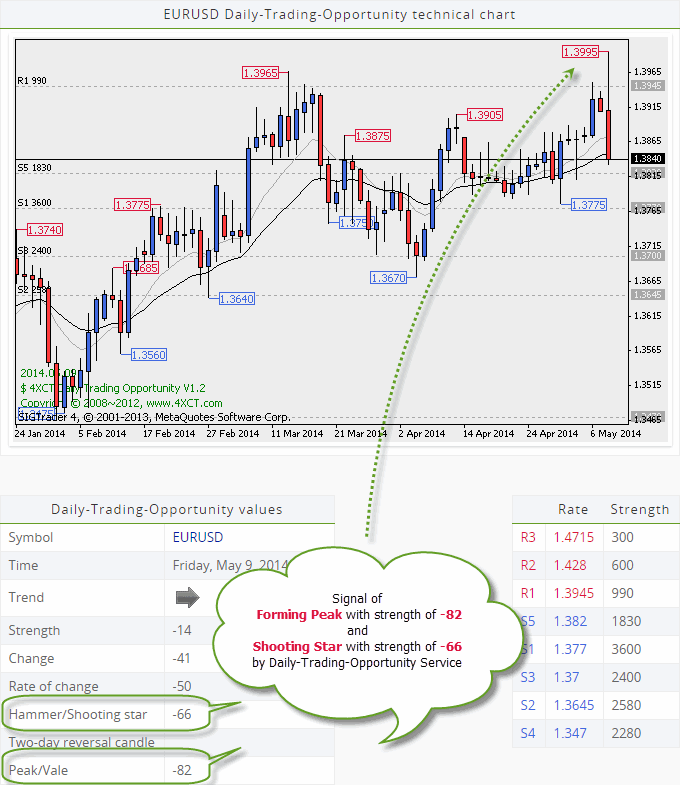
On 2014-05-09 (Figure 5), both a daily Shooting Star and a daily Peak formed in the Sell zone on the same day, launching a downtrend that earned 10287 pips in 150 trading days.
In Figure 6, the DTO scanner table from 2014-05-09 shows both the Shooting Star (strength -66) and the Peak (strength -82) on EURUSD.
Rule 1: for Friday patterns, enter early Monday?
If a daily entry pattern forms on Friday, do not enter on Friday night. Wait and open your trades when the market opens on Monday morning for three reasons:
No weekend swap fees: You avoid paying overnight swap charges for Saturday and Sunday.
No weekend gap risk: Wars, elections, or natural disasters over the weekend can cause a Monday morning price gap. You enter on Monday morning only if the market opens normally without a gap.
Updated Saturday targets: You can check the new Weekly Forecast published on Saturday and use the newest take-profit levels.
Because of this rule, no entry mark appears on Friday night's chart. Once Monday's open confirms normal conditions, the Buy or Sell mark appears on the next week's chart.
Rule 2: patterns that form near a Buy or Sell zone?
Buy zones and Sell zones are approximate support and resistance bands. Sometimes price forms a daily reversal pattern just before touching the edge of the zone.
Measure the gap between the pattern and the nearest edge of the zone. If that distance is less than half of the 264-day Average True Range (ATR(264) / 2), the entry pattern is valid and you can take the trade.