
You can keep every oil and natural gas trade within a strict 1% risk cap once you size positions from each contract's unit value: 1000 barrels per 1.00 lot on WTI and BRENT ($1000 per $1.00 move) and 10000 MMBtu per 1.00 lot on NGAS ($1000 per $0.10 move). In ForecastCity, AI Strategy Studio and Virtual account testing let you build, run, and audit your energy trading plan fast and accurately before risking live money.
How do you calculate lot size for WTI, Brent, and natural gas?
Before you place a trade on crude oil or natural gas, check how many physical barrels or heat units your broker packs into 1.00 standard lot. Following NYMEX and ICE futures standards (CME Group, 2024), most brokers define 1.00 standard lot of WTI (USOIL) and Brent (UKOIL) as 1000 barrels of oil. That means a 0.10 mini lot controls 100 barrels, and a 0.01 micro lot controls 10 barrels (some brokers also offer mini-oil contracts where 1.00 lot equals 100 barrels, so always check your contract specification window once).
Here is how simple the barrel math is on a standard 1000-barrel contract: whenever crude oil moves by $1.00 per barrel (say from $74.00 to $75.00), your profit or loss changes by $1000 on a 1.00 lot, $100 on a 0.10 lot, and $10 on a 0.01 micro lot. On Henry Hub natural gas (NGAS), 1.00 standard lot equals 10000 MMBtu (100 MMBtu per 0.01 micro lot); because gas is quoted around $2.00 to $4.00, a $0.10 move (ten cents, such as $2.50 to $2.60) equals $1000 on a 1.00 lot and $10 on a 0.01 micro lot.
The table below compares dollar movement and maximum lot size for a $10000 account risking 1% ($100) per trade across typical daily Average True Range (ATR) stop distances:
| Instrument | Contract Size (1.00 Lot) |
Dollar Value per Price Unit (1.00 / 0.10 / 0.01 Lot) |
Example Daily Zone Stop Distance | Max Lot Size for $100 Risk (1% of $10000) |
|---|---|---|---|---|
WTI Crude (USOIL) |
1000 barrels |
$1.00 move = $1000 / $100 / $10 |
$2.50 per barrel |
0.04 lots (40 barrels = $100 risk) |
Brent Crude (UKOIL) |
1000 barrels |
$1.00 move = $1000 / $100 / $10 |
$2.50 per barrel |
0.04 lots (40 barrels = $100 risk) |
Natural Gas (NGAS) |
10000 MMBtu |
$0.10 move = $1000 / $100 / $10 |
$0.20 per MMBtu |
0.05 lots (500 MMBtu = $100 risk) |
Key strategy components for oil and natural gas
When you configure an energy trading plan in AI Strategy Studio, four structural elements protect your capital from inventory spikes, weekend OPEC+ gaps, and rollover costs:
ATR-Scaled Lot Formula: Divide your fixed dollar risk by
(Stop Distance × Contract Value per Unit)so a wider$3.20oil stop automatically lowers your lot size compared to a calmer$1.80stop.Daily Soft Stop Loss Buffer: Wait for the daily (
D) candle to close outside the4CastMachine AIBuy or Sell zone instead of letting a Wednesday10:30New YorkEIAwick trigger an intraday stop.Stepped Profit Targets (TP1–TP3 + Free Trade): Take partial profit at TP1 and TP2 during multi-week
OPEC+or weather trends while keeping a risk-free runner after moving your stop to Break-Even.Inventory Window Filter: Pause new manual market entries during the 15 minutes before and after Wednesday and Thursday
10:30New YorkEIAreleases.
How do you build an energy strategy in AI Strategy Studio?
Open AI Strategy Studio, launch the AI Trading Assistant, and describe your crude oil or natural gas trading plan in plain words (by text or voice). For example, ask it to create a daily Trend Hunter strategy for WTI and BRENT with 1% risk per trade, entries inside 4CastMachine AI Buy and Sell zones, a daily candle-close Soft Stop Loss, and stepped exits at TP1 and TP2 with a Free Trade runner.
The assistant fills in all four parts of the builder (Market & Timeframe, Entry, Exit, and Risk Management) and scores your setup on the Completeness Meter. You can review or adjust any parameter in the risk and position-size settings before saving.
How do you test and audit your oil strategy before risking cash?
Once your energy trading plan is saved, attach it to a dedicated Virtual account funded with your realistic starting balance (such as $10000). Run it across at least 4 to 6 weekly EIA inventory releases and one monthly futures rollover. When you also practice on your broker's MetaTrader 4 or 5 demo account, install ForecastFollow from your member dashboard so weekly forecast zones appear directly on your chart.
At the end of each week, open AI Trading Journal and inspect the Strategy check card. The journal grades your closed WTI, BRENT, and NGAS trades against your saved rules and shows the exact dollar cost of any rule you broke, such as over-sizing a winter natural gas trade or panic-closing during a Wednesday 10:30 New York EIA wick.
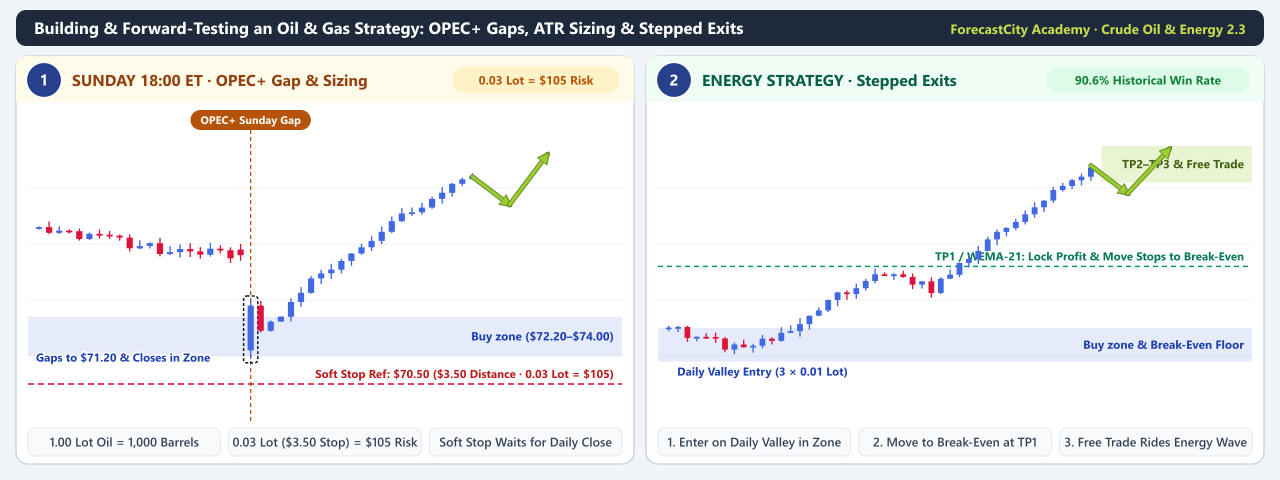
OPEC+ weekend gap and ATR barrel sizing: Because
1.00standard oil lot equals1000barrels, a$3.30stop distance from a$74.80entry above the$73.00–$74.50Buy zone down to the$71.50Soft Stop requires sizing down to0.03lots (30barrels) to keep total risk inside$100(1%of a$10000account).Stepped exits, Break-Even, and Free Trade runner: Splitting
0.03lots into three0.01-lot (10-barrel) orders banks profit atTP1($77.80) andTP2($80.50), moves stops to Break-Even afterTP1, and lets the third order ride the multi-week energy wave as a Free Trade.