
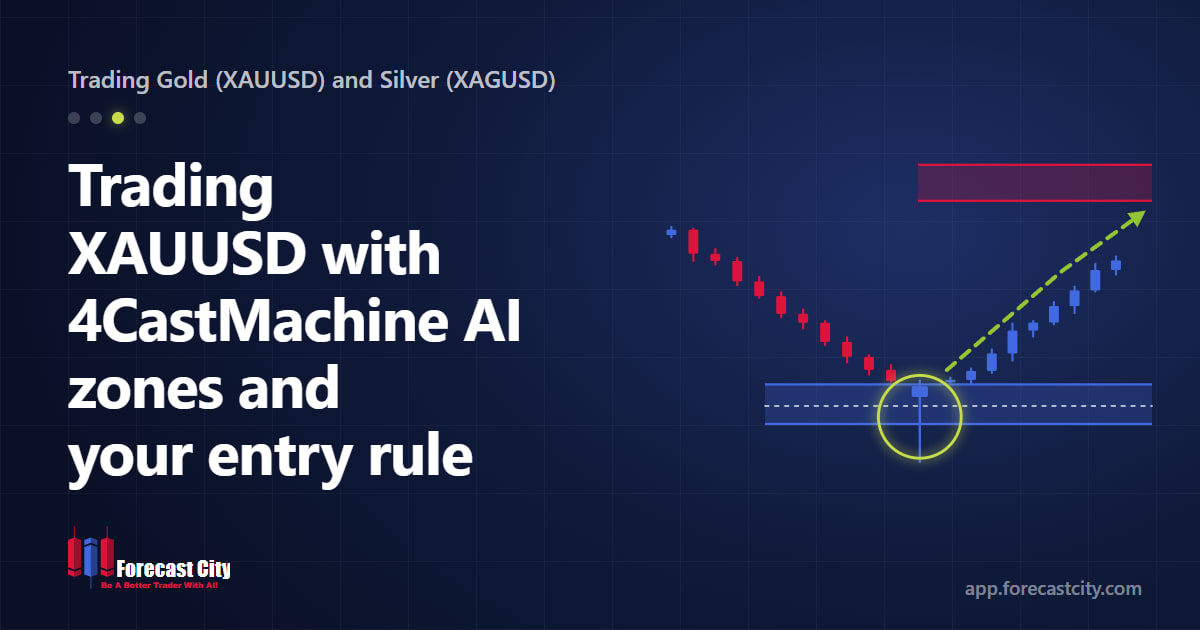
Institutional orders on Spot Gold (XAUUSD) cluster around whole 50-dollar and 100-dollar levels such as 2600, 2650, and 2700, creating routine 8-dollar to 15-dollar stop sweeps past single horizontal lines. Combining 4CastMachine AI Buy, Sell, and Reverse zones with a closed daily candlestick pattern keeps you out of false breakouts and aligns you with the real wave. In ForecastCity, 4CM-AI Charts draws these zones automatically on XAUUSD and XAGUSD so you can spot high-probability setups fast and accurately.
Why does Gold (XAUUSD) sweep single support and resistance lines before reversing?
To understand why Gold so often pokes through an obvious support line and then immediately reverses higher, put yourself in the shoes of an institutional bullion desk. Suppose a sovereign fund or large bank needs to buy 50000 ounces of Gold (500 standard lots) near 2600. If that bank clicks "Buy" at market in one piece, there are not enough sellers at 2600, so its own buying will push the price up to 2615 and ruin its entry price.
To buy 50000 ounces at 2600 or cheaper without moving the market up, the bank needs thousands of other traders to sell at the exact same moment. Where can it find thousands of automatic sell orders waiting in one place? Right below the round number 2600! Every retail trader who bought Gold early at 2605 or 2608 placed a protective stop-loss order just below 2600 (say at 2596), and remember that a buyer's stop-loss order is an instruction to sell. At the same spot, breakout traders also place pending sell-stop orders hoping to catch a crash.
When Spot Gold (XAUUSD) dips to 2596 or 2591 during the New York open, all those clustered retail stop-loss orders and breakout sell orders fire automatically. That wave of forced selling hands the institutional desk the exact liquidity it needs to fill its 50000-ounce buy order at a discount, and Gold immediately rallies 80 to 100 dollars higher. Treating support and resistance on Gold as a price band (zone) rather than a single thin line protects you from this round-number stop sweep.
How do Buy zones, Sell zones, and Reverse zones work on daily vs intraday Gold charts?
When you open XAUUSD or XAGUSD in 4CM-AI Charts, the forecast layer is always on by default and displays the roadmap generated by the four Quad-AI engines of 4CastMachine AI. How you use the zones depends on whether you are viewing the daily (D) chart or an intraday chart (4h to 5m):
Buy zone on XAUUSD: The shaded support band starting at the pivot where 4CastMachine AI expects a bullish wave to begin once a reversal pattern forms.
Sell zone on XAUUSD: The shaded resistance band starting at the pivot where 4CastMachine AI expects a bearish wave to begin.
Reverse zone on intraday charts: The band beyond the pivot on
4hand lower timeframes whose dashed green arrows map the alternate path and its targets if price breaks the pivot and stays there.Daily confirmation pattern: A closed daily Hammer, Valley, Shooting Star, or Peak inside the zone that proves buyers or sellers defended the level.
ATR(264) / 2 near-zone buffer: The Trend Hunter Strategy entry rule allowing entry when a daily reversal pattern closes within half of the 264-day ATR of the zone edge.
How does a two-stage Gold entry compare with a blind limit order or a 5m breakout?
Waiting for two things to line up on XAUUSD (price reaching a 4CastMachine AI zone first, and a candlestick confirmation closing second) filters out the vast majority of losing Gold trades. Compare the three ways traders react when Gold drops toward a major support area:
| Entry method on XAUUSD | What triggers the trade | What happens during a 15-dollar news spike |
|---|---|---|
| Blind Buy Limit at 2600 | Touch of a single horizontal number with no candle check | Fills instantly during a heavy breakdown candle and hits a tight stop loss minutes later. |
| Intraday 5m / 15m breakout | Chasing a fast green or red candle during London or NY open | Enters at the worst price right before the LBMA or COMEX liquidity sweep reverses. |
| Two-stage Trend Hunter entry (D) | Price enters Saturday's Buy zone (2600 to 2618) and closes a daily Hammer or Valley |
Ignores the intraday dip to 2595, enters after the daily candle closes back inside the zone, and rides the multi-week wave. |
Two-stage Gold setup timeline: On Saturday, 4CastMachine AI maps a daily Buy zone on XAUUSD between 2600 and 2618, with green arrows pointing toward targets up to 2720. On Tuesday at 13:00 UTC, Gold dips to 2596, sweeps retail stops below 2600, and rallies to close the daily candle at 2615 as a daily Hammer. That closed Hammer triggers your stepped Buy orders at the start of a 105-dollar uptrend.
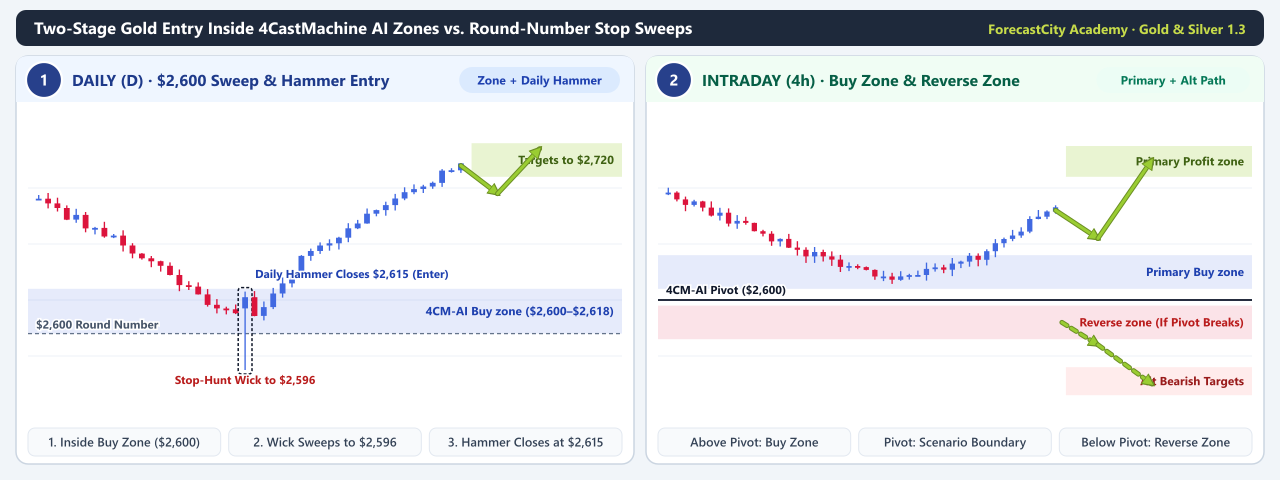
Daily 2600 stop sweep and two-stage Hammer entry: Intraday wicks to
2596trigger blind limit orders and tight stops below2600, whereas waiting for the daily Hammer to close at2615inside the2600–2618Buy zone confirms institutional buying before the105-dollar rally to2720.Intraday 4h primary path vs. Reverse zone: On
4hand lower timeframes, the solid arrows from the Buy zone show the main bullish forecast, while the shaded Reverse zone below the pivot and its dashed arrows map the alternate bearish path if price breaks and holds below the pivot.
How can you automate your 4CM-AI zone and pattern rule in AI Strategy Studio?
You do not need to watch Gold charts during the London or New York sessions to catch a two-stage setup. During your 15-minute Saturday review, open AI Strategy Studio in 4CM-AI Charts and launch AI Trading Assistant.
Tell the assistant in your own voice or in writing: "Build a strategy on XAUUSD that enters when price is inside the 4CM-AI Buy zone and completes a Hammer, sets Stop Loss at the 4CM-AI pivot, takes profit at TP1 to TP3, and moves the stop to Break-Even after TP1." Click Show on chart to preview the lines on Gold, click Save, and turn on Watch symbols and read your trading plan when an alert fires so ForecastCity notifies your phone or MetaTrader the moment the setup completes.