
You can trade energy markets with much higher confidence once you know how delivery hubs, crude density (API gravity), and sulfur content separate BRENT, WTI, the OPEC Reference Basket, and Henry Hub natural gas (NGAS). In ForecastCity, 4CastMachine AI maps weekly price zones onto the daily (D) chart across every major oil and gas contract so you can spot clean setups fast and accurately.
What separates Brent crude, WTI, and the OPEC basket?
Not all crude oil pumped out of the ground is the same. Some oil comes out of the earth as a thin, free-flowing liquid with very few impurities, while other oil comes out thick, heavy, and full of sulfur. Because refineries buy crude oil to turn it into high-value fuels like gasoline, diesel, and jet fuel, they judge every barrel by three simple physical traits: how light it is, how little sulfur it contains, and where it is delivered (CME Group, 2024).
First, refineries measure how light or heavy an oil is using the API gravity scale (from 10° to 70°, where water is 10°). The higher the number, the lighter and thinner the oil. Any crude oil scoring above 31.1° is called light crude, and refineries pay more for it because it naturally produces a high share of gasoline and jet fuel without expensive heavy processing. Second, refineries measure how much sulfur is mixed into the oil: crude with less than 0.50% sulfur is called sweet, while crude above 0.50% sulfur is called sour and requires costly treatment to remove corrosive sulfur before the fuel can be sold.
Although both Brent Crude (BRENT / UKOIL) and West Texas Intermediate (WTI / USOIL) are light and sweet, their delivery locations are completely different. BRENT is pumped from fields in the North Sea (Brent, Forties, Oseberg, Ekofisk, and Troll, plus US Midland crude) and loaded straight onto ocean supertankers, making it the global price benchmark for roughly two-thirds of the world's oil. By contrast, WTI is delivered to a landlocked network of pipelines and storage tanks in Cushing, Oklahoma, hundreds of miles from the ocean, so its price reacts strongly to US Midwest refinery maintenance and pipeline capacity (U.S. Energy Information Administration, 2024).
Key energy benchmark terms you must know
Energy market reports and broker contract specifications rely on five foundational terms:
API Gravity: An inverse measure of petroleum density compared to water. Crudes above
31.1°are classified as light and yield more high-value transportation fuels.Sweet vs. Sour Crude: Crude oil with less than
0.50%sulfur by weight is called sweet. Crude above0.50%sulfur is called sour and needs costly refining treatment.Brent-WTI Spread: The price difference per barrel between North Sea
BRENTand CushingWTI, reflecting ocean tanker freight and US pipeline bottlenecks.OPEC Reference Basket: A weighted average of 12 crude blends from
OPECmembers (around32.5°gravity and1.7%sulfur) that prices Middle Eastern and African physical shipments.Henry Hub Natural Gas (NGAS): The benchmark US natural gas contract priced in dollars per million British thermal units (
$/MMBtu) at the Erath, Louisiana pipeline hub.
Comparing Brent, WTI, OPEC, and Henry Hub natural gas
The table below compares the four primary energy benchmarks across physical quality, delivery hub, and primary price drivers:
| Feature | Brent Crude (BRENT / UKOIL) |
West Texas Intermediate (WTI / USOIL) |
OPEC Reference Basket (ORB) |
Henry Hub Natural Gas (NGAS) |
|---|---|---|---|---|
| Density & Sulfur | Light Sweet (~38.0° gravity, 0.37% sulfur) |
Light Sweet (~39.6° gravity, 0.24% sulfur) |
Medium Sour average (~32.5° gravity, 1.70% sulfur) |
Methane pipeline gas (measured by heat content in MMBtu) |
| Delivery Location | North Sea waterborne tanker terminals | Cushing, Oklahoma storage & pipeline hub | FOB export ports across Middle East, Africa, and South America | Henry Hub interconnect, Erath, Louisiana |
| Standard 1.00 Lot Size | 1000 barrels ($1000 per $1.00 move) |
1000 barrels ($1000 per $1.00 move) |
Physical spot index (not a retail CFD contract) | 10000 MMBtu ($1000 per $0.10 move) |
| Typical Daily ATR | $1.80 to $3.20 per barrel |
$1.70 to $3.10 per barrel |
Tracks physical official selling prices (OSP) |
$0.12 to $0.30 per MMBtu (4%–9% daily swings) |
| Primary Macro Drivers | Global seaborne demand, Red Sea / Hormuz shipping, OPEC+ quotas |
US shale output, Cushing tank levels, Wednesday EIA reports |
OPEC+ ministerial quotas and Asian refinery demand |
US winter heating / summer cooling weather, LNG exports, Thursday EIA storage |
Why does Brent usually trade at a premium to WTI?
New energy traders often notice a puzzle in the table above: WTI is slightly lighter (39.6° vs. 38.0°) and slightly sweeter (0.24% vs. 0.37% sulfur) than BRENT, yet BRENT almost always trades $2.00 to $5.00 per barrel higher. The reason is simple geography and transportation cost.
Because BRENT barrels are loaded directly onto ocean tankers in the North Sea, a buyer can sail that cargo straight to any coastal refinery in Europe, Asia, or the Americas. By contrast, physical WTI sits inside storage tanks in landlocked Cushing, Oklahoma. For an overseas refinery to buy WTI, it must first pay pipeline fees to pump the oil hundreds of miles south from Oklahoma to the Texas Gulf Coast and load it onto a ship. Those extra pipeline and port costs keep WTI discounted relative to waterborne BRENT (U.S. Energy Information Administration, 2024).
When US shale oil production in Texas grows rapidly while Midwest refineries close for seasonal maintenance in April or October, oil backs up inside the Cushing storage tanks. That local oversupply pushes WTI down and can widen the Brent-WTI spread from $3.50 to $6.50 per barrel. Conversely, when geopolitical shipping disruptions hit the Red Sea or the Strait of Hormuz, international buyers scramble for immediate seaborne cargoes, causing BRENT to spike faster than landlocked WTI.
How does Henry Hub natural gas differ from crude oil?
Crude oil is a liquid fuel stored in barrels and shipped across oceans to power cars, trucks, ships, and airplanes, so its price moves mainly with world economic growth and OPEC+ production quotas. By contrast, Henry Hub natural gas (NGAS) is a gas used primarily to heat homes and offices in the winter and to spin power-plant turbines for air conditioning in the summer.
Because natural gas travels mainly through regional underground pipelines, and chilling gas to -162°C into liquid form (LNG) for ocean tankers is expensive and limited by terminal capacity, NGAS is far more sensitive to local weather than crude oil. A sudden 10-day forecast for freezing January weather in Chicago and New York, or an unexpected outage at a Gulf Coast LNG export plant, can send NGAS surging or dropping by 6% to 10% in a single day while WTI crude moves less than 1%.
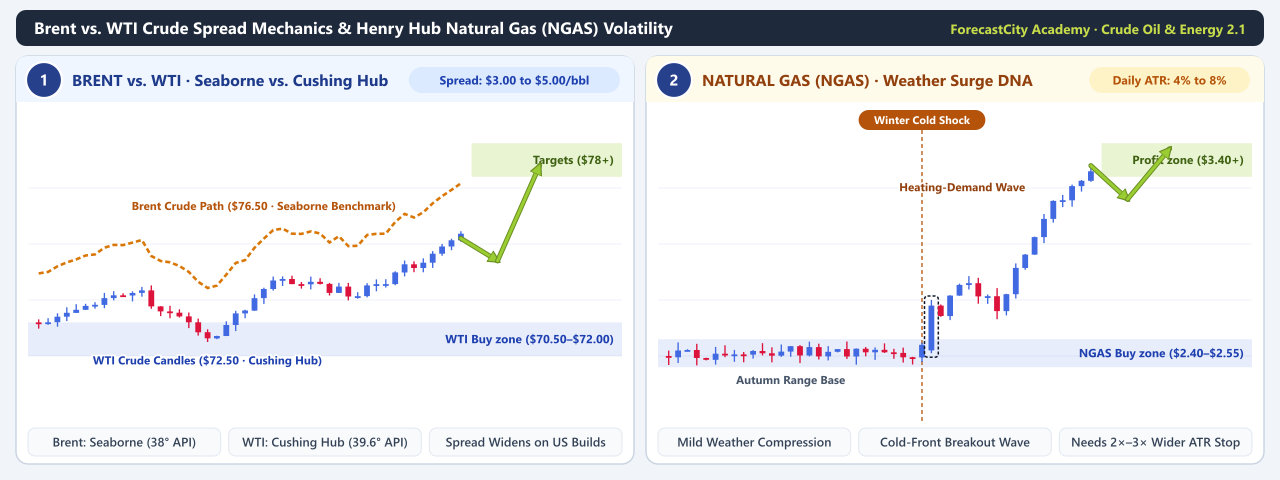
Brent vs. WTI and the seaborne-to-Cushing spread: Waterborne
BRENTnormally trades$3.00to$5.00per barrel above landlocked CushingWTI, and that spread widens past$5.00whenever Cushing storage fills up or shipping risks lift seaborne cargoes.Henry Hub Natural Gas weather surge DNA: With a
10000 MMBtucontract size and4%to8%daily ATR swings, a closed daily Hammer inside the$2.45–$2.60Buy zone captures winter heating or summer power-cooling rallies towardTP1andTP2.
How do Trend Hunter daily zones adapt across Brent, WTI, and NGAS?
Instead of trading noisy 5m or 15m correlations between BRENT and WTI, the daily (D) Trend Hunter Strategy uses Saturday's 4CastMachine AI weekly updates to map independent Buy zone and Sell zone boundaries for each contract. When BRENT trades at $78.40 and WTI trades at $74.20, 4CastMachine AI calculates separate daily zones and stepped targets (TP1, TP2, and a runner for Free Trade) matched to each market's volatility.
In AI Strategy Studio, you can ask the AI Trading Assistant by text or voice to build an energy trading plan that selects whichever benchmark shows the cleaner daily zone on Saturday. Every technical term is defined in the Trading & Market Mechanics Glossary, and every study, exchange specification, and agency report cited across this course is listed alphabetically on Sources.
Lessons in this course
Work through these three lessons to build and test a complete crude oil and natural gas trading workflow:
How Brent Crude, WTI, OPEC, and Natural Gas differ: compare physical crude grades, delivery terminals, the
Brent-WTIspread, and Henry Hub natural gas behavior.How to trade EIA inventory reports and OPEC+ volatility: navigate Tuesday
API, WednesdayEIApetroleum, and Thursday natural gas releases with daily Soft Stop Loss rules.How to build and test an oil and gas strategy with AI: calculate
1000-barrel and10000-MMBtulot sizes, build your strategy in AI Strategy Studio, and test it on a Virtual account.