
You can avoid getting stopped out by sudden mid-week oil spikes once you know the weekly energy release schedule: Tuesday's API stockpile estimate at 16:30 New York time, Wednesday's official EIA petroleum report at 10:30 New York time, and Thursday's EIA natural gas storage report at 10:30 New York time. In ForecastCity, Saturday's 4CastMachine AI zones and the daily candle-close Soft Stop Loss help you ride through those intraday whipsaws fast and accurately.
When are weekly API and EIA inventory reports released?
Unlike inflation or employment reports that come out only once a month, physical supply-and-demand data for oil and gas arrives every single week during the New York session. Each report answers one simple question: over the past seven days, did the United States produce and import more fuel than it consumed (an inventory build, meaning storage tanks filled up), or did refineries and exports use more fuel than came in (an inventory draw, meaning storage tanks drained)?
When a US federal holiday falls on a Monday (such as Memorial Day or Labor Day), both the API and EIA petroleum reports shift 24 hours later to Wednesday afternoon and Thursday morning (U.S. Energy Information Administration, 2024). The table below details the four recurring fundamental catalysts that drive crude oil (WTI and BRENT) and natural gas (NGAS) volatility:
| Release / Catalyst | Normal Schedule (New York Time / UTC Winter) | Primary Instruments Affected | What the Market Compares Against Consensus | Typical 30-Minute Price Reaction |
|---|---|---|---|---|
| API Weekly Statistical Bulletin | Tuesday 16:30 NY (21:30 UTC) |
WTI, BRENT |
Voluntary industry survey of US commercial crude, gasoline, and distillate changes | $0.50 to $1.20 per barrel move in thin post-settlement trading |
| EIA Weekly Petroleum Status Report | Wednesday 10:30 NY (15:30 UTC) |
WTI, BRENT |
Mandatory government count of US crude stocks, Cushing tanks, refinery runs, and implied demand | $1.20 to $2.80 per barrel two-way whipsaw before trend settles |
| EIA Weekly Natural Gas Storage | Thursday 10:30 NY (15:30 UTC) |
NGAS |
Net injection or withdrawal in billion cubic feet (Bcf) vs. the 5-year seasonal average |
$0.08 to $0.22 per MMBtu (3%–7% immediate swing) |
| OPEC+ Ministerial & JMMC Meetings | Scheduled monthly / quarterly (often weekends) | BRENT, WTI |
Voluntary production cuts, quota revisions, and phased barrel return schedules | $2.00 to $5.00 per barrel Sunday opening gap or multi-day trend |
Why does crude oil whipsaw in both directions at 10:30 on Wednesday?
Beginners watching crude oil at 10:30 New York time on Wednesday are often baffled when WTI plunges $1.50 in the first minute and then rockets $2.50 higher two minutes later. That two-way whipsaw happens because the EIA Weekly Petroleum Status Report is not a single number; it is a multi-line balance sheet read in two distinct waves.
In the first wave at 10:30:00 New York time, high-speed news algorithms read only the top headline number (total US commercial crude oil inventory change) and fire instant market orders. In the second wave, 60 to 180 seconds later, institutional energy desks read the inside lines of the table: how much oil is left at the Cushing delivery hub, whether gasoline and diesel stocks fell (proving strong consumer fuel demand), and how fast refineries are running.
Suppose WTI trades at $73.50 on Wednesday morning and the market expects a 1.5 million barrel drawdown. At 10:30 NY, the headline prints a surprise 2.8 million barrel build (extra crude supply), so headline algorithms dump WTI down $1.40 to $72.10. Ninety seconds later, institutional traders see why crude rose: a temporary Gulf Coast import wave arrived, while Cushing delivery hub stocks actually drained by 1.9 million barrels and gasoline demand jumped! Institutional buyers step in heavily, reversing WTI up $2.60 from the low to close the day at $74.70.
Key energy volatility and futures curve terms
Beyond weekly inventory reports, oil and gas prices are shaped by how current-month delivery contracts compare against future months (known as the futures curve). Track these four structural concepts:
Inventory Build vs. Draw: A build means commercial storage rose week-over-week (bearish if above forecast). A draw means storage fell as refinery demand or exports topped supply (bullish if above forecast).
Cushing Hub Utilization: The volume of crude stored at the Cushing, Oklahoma delivery hub for
WTI. When Cushing stocks drop near operational tank minimums (20–22million barrels), front-monthWTIspikes sharply.Backwardation: A tight physical market where the current-month oil contract trades higher than later months (for example, June oil at
$76.00vs. July at$75.20) because buyers pay a premium for immediate barrels.Contango: An oversupplied market where current-month oil trades cheaper than later months (for example, June at
$70.00vs. July at$70.80) to cover tank storage costs, creating a negative rollover adjustment when CFD contracts switch months.
How does the daily Soft Stop Loss survive EIA and OPEC+ shocks?
A trader using a 15m chart with a $0.60 hard stop at $72.90 during the Wednesday example above gets stopped out at $72.10 right before WTI rallies to $74.70. In the daily (D) Trend Hunter Strategy, you trade from Saturday's 4CastMachine AI Buy zone (for example, $71.80–$73.20).
Instead of placing a tight intraday broker stop inside Wednesday's noise range, you use the Soft Stop Loss rule. An intraday wick below $71.80 at 10:31 New York time does not close your trade unless a healthy daily candle closes outside the zone at day's end. When the Wednesday spike reverses from $72.10 and closes at $74.70, your daily trade stays open to reach TP1 ($75.80), TP2 ($77.50), and your Free Trade runner.
To avoid opening new trades seconds before a release, pause manual market orders during the 15 minutes around Wednesday and Thursday 10:30 New York reports. Instead, set strategy and price alerts so ForecastCity notifies you when an EIA spike pushes price into a fresh 4CastMachine AI Buy zone or Sell zone at a discount.
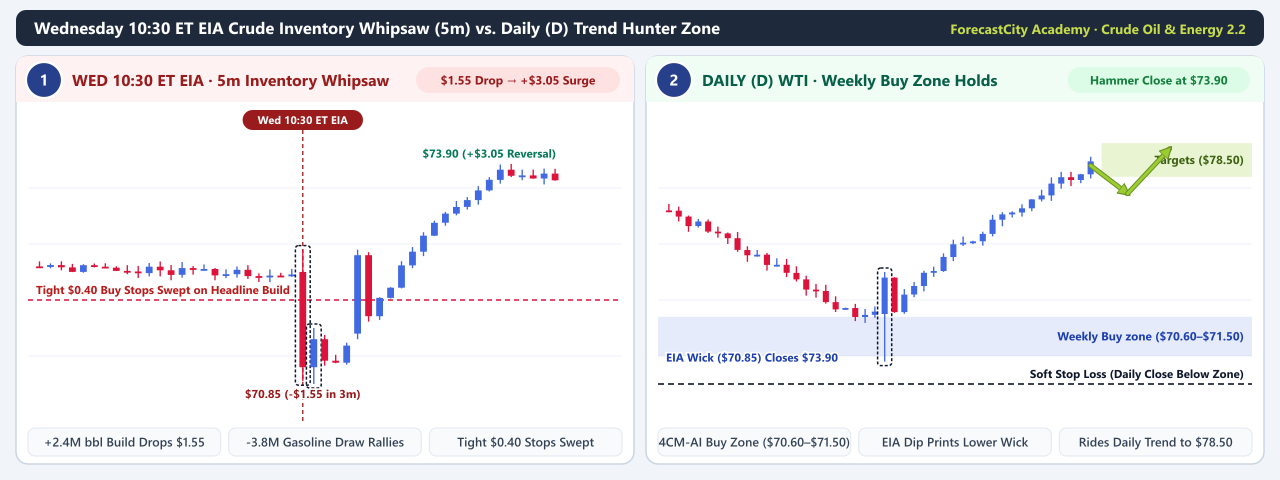
Wednesday 10:30 NY 5m EIA inventory whipsaw: Headline algorithms slam
WTIdown to$70.85(sweeping tight intraday stops below$71.50) before Cushing drawdown details reverse price sharply up to$73.90within minutes.Daily Trend Hunter Buy zone and Soft Stop Loss: On the daily (
D) chart, the10:30NY dip to$70.85is only a lower wick that never closes a daily candle below the$71.20–$72.40Buy zone, allowing the daily Hammer close at$73.90to ride the trend toTP1($76.50) andTP2($79.20).