
Spot Gold (XAUUSD) moves an average of 25 to 45 dollars per day, driven by three main macroeconomic forces: US 10-year real Treasury yields (TIPS), the US Dollar Index (DXY), and central bank reserve purchases. Spot Silver (XAGUSD) follows those same monetary waves plus industrial factory demand, which makes Silver swing roughly 1.5 to 2 times wider in percentage terms. In ForecastCity, 4CastMachine AI maps these weekly and daily waves directly onto your daily (D) chart so you can build your trading plan simply, fast, and accurately.
What macroeconomic forces drive Spot Gold (XAUUSD) prices?
To understand why Gold rises or falls, start with one simple fact: a bar of Gold sitting in a bank vault pays zero interest and no dividend. Because of that, large investment funds constantly compare holding Gold against holding safe US government bonds. What matters to them is not the headline bond interest rate alone, but how much profit a bond pays after subtracting inflation, known as the US real yield (TIPS).
Suppose a 10-year US Treasury bond pays 4.5% annual interest while annual inflation is 2.5%. An investor holding that bond earns a clean +2.0% real profit above inflation (4.5% - 2.5% = +2.0%), so large funds prefer interest-paying bonds over non-yielding Gold, which puts downward pressure on XAUUSD. Now suppose inflation rises to 3.5% while the Federal Reserve cuts bond yields to 3.0%: the real return on bonds drops to -0.5%, meaning cash in bonds is losing purchasing power every year. Institutional investors immediately shift capital out of bonds and into Gold to protect their purchasing power, driving XAUUSD into a strong uptrend.
The second everyday driver is the value of the US dollar itself, tracked by the US Dollar Index (DXY). Because Gold is priced globally in US dollars per ounce, a weaker US dollar makes Gold cheaper for buyers paying in euros, yen, yuan, or rupees, which boosts global buying and lifts XAUUSD. The third driver is physical buying by central banks: data from the World Gold Council (2024) show that when central banks purchase more than 1000 metric tons of Gold per year for their national reserves, they permanently remove that supply from the market and create a strong support cushion during price pullbacks.
US real yield (TIPS): The return on 10-year US Treasury bonds minus expected inflation; falling or negative real yields are the strongest fuel for a Gold rally.
US Dollar Index (DXY): A basket measuring the US dollar against six major currencies; a falling dollar makes dollar-priced Gold cheaper for international buyers and normally pushes
XAUUSDhigher.Central bank reserve demand: Multi-year physical bullion purchases by central banks that stay locked in national vaults and build a long-term price floor under Gold.
Gold-to-Silver Ratio (GSR): The price of one ounce of Gold divided by one ounce of Silver (
XAUUSD / XAGUSD), showing how many ounces of Silver equal one ounce of Gold.LBMA Gold Price auction: The twice-daily wholesale physical clearing benchmark set in London at
10:30and15:00London time.
How does Silver (XAGUSD) behave differently from Gold, and what is the Gold-to-Silver Ratio?
Beginners often assume Spot Gold (XAUUSD) and Spot Silver (XAGUSD) move at the exact same speed, but their physical demand is very different. Roughly 90% of Gold demand comes from investment, central bank vaults, and jewelry, so Gold acts almost purely as a monetary and safe-haven asset. By contrast, Silver has a dual identity: half monetary metal and half industrial raw material, with more than 50% of annual Silver supply consumed by factories building solar panels, electronics, and electric vehicles.
In addition, the total dollar value of the global Silver market is much smaller than the Gold market, much like a light speedboat compared to a giant ocean tanker. When institutional money flows into precious metals, that same wave of capital pushes XAGUSD roughly 1.5 to 2 times further in percentage terms than XAUUSD.
To see which metal offers better value at any moment, traders watch the Gold-to-Silver Ratio (GSR = XAUUSD / XAGUSD). For example, if Gold trades at 2640 and Silver trades at 31.00, dividing 2640 by 31.00 gives a ratio of 85.1, meaning one ounce of Gold costs as much as 85.1 ounces of Silver. At the start of an economic scare, investors rush into Gold first while factory demand for Silver stays quiet, pushing the ratio above 85 (Silver becomes historically cheap relative to Gold). Later, as the precious-metals uptrend matures and industrial buying joins in, Silver catches up with 1.5× to 2× percentage surges and compresses the ratio down toward 65 or 70.
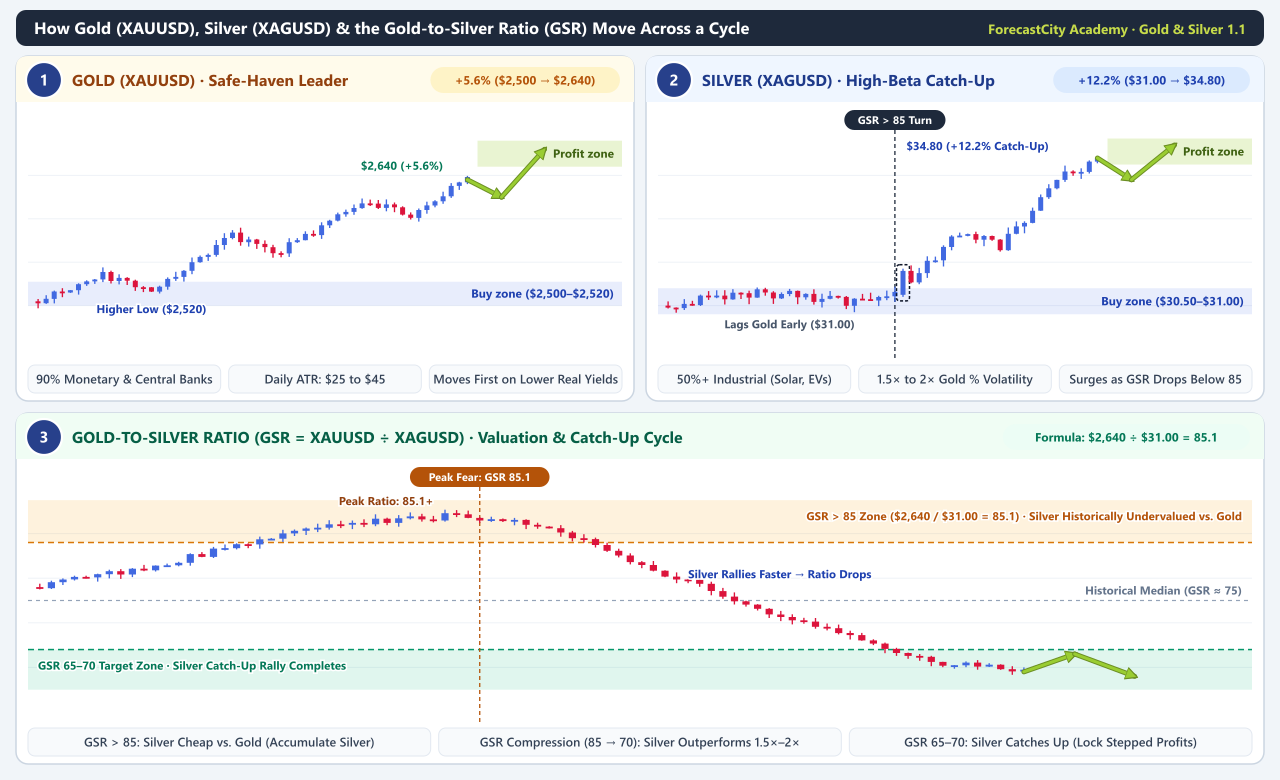
Gold (XAUUSD) as safe-haven leader: When real Treasury yields fall, central banks and institutional funds enter Gold first, driving a steady climb from the
Buy zonetoward its price targets.Silver (XAGUSD) 1.5x to 2x high-beta catch-up: Silver lags early in the move, then accelerates roughly twice as fast in percentage terms once the Gold-to-Silver Ratio turns down from above
85and industrial demand joins the precious-metals uptrend.Gold-to-Silver Ratio (GSR) valuation wave: When
XAUUSD / XAGUSDrises above85(such as2640 / 31.00 = 85.1), Silver is historically cheap relative to Gold. As Silver outperforms, the ratio compresses toward the65to70target band.
When do London (LBMA) and New York (COMEX) sessions create peak Gold liquidity?
Spot Gold and Silver trade 23 hours a day from Sunday evening to Friday evening in New York, but price does not move evenly across the clock. Two global centers control price discovery: London, where wholesale physical bullion bars are cleared through the LBMA, and New York, where institutional futures contracts trade on the COMEX futures market of CME Group (2024).
The four-hour window when London afternoon trading overlaps with the New York morning session (12:30 to 16:30 UTC) brings both physical banks and futures funds into the market at the same time. That overlap also coincides with major US economic releases at 08:30 New York time (such as CPI and FOMC releases), producing the deepest liquidity and largest daily moves on XAUUSD.
| Trading session | Time window (UTC) | Typical XAUUSD range | Market behavior and main participants |
|---|---|---|---|
| Asian session (Tokyo and Shanghai) | 00:00 to 07:00 UTC |
8 to 15 dollars |
Physical demand from China (SGE) and Asian jewelers. Often trades inside a quiet range unless geopolitical news breaks. |
| London morning (LBMA AM auction) | 07:00 to 12:00 UTC |
12 to 22 dollars |
European bullion banks open. The first LBMA auction at 10:30 London time often sets the initial daily high or low. |
| London and New York overlap (COMEX) | 12:30 to 16:30 UTC |
20 to 40 dollars |
COMEX pit opens at 08:20 New York time, US economic data drops at 08:30 NY, and the LBMA PM auction runs at 15:00 London time. |
| New York afternoon and rollover | 17:00 to 21:00 UTC |
6 to 12 dollars |
COMEX pit closes. Liquidity thins sharply during the 17:00 NY daily settlement hour, widening broker spreads. |
Example of a New York overlap whipsaw on XAUUSD: At 12:30 UTC (08:30 New York), a US Consumer Price Index (CPI) report prints 0.1% above consensus. Spot Gold drops 22 dollars from 2630 to 2608 in two minutes as algorithms sell the headline, then reverses 38 dollars higher to close the daily candle at 2646 once 10-year real yields pull back.
Why do CPI and rate releases wipe out intraday Gold scalpers while the daily Trend Hunter Strategy holds the wave?
In the CPI example above, a trader scalping the 5m or 15m chart with a 5-dollar (50-pip) stop loss gets wiped out in seconds during the two-way news spike. Even worse, trading both sides of the spike with high borrowing ratios turns a single afternoon into a string of losses.
The Trend Hunter Strategy solves this problem by moving your decisions to the daily (D) timeframe. Every Saturday, when the market is closed and calm, 4CastMachine AI updates its Weekly Forecasts on 4CM-AI Charts. When you open XAUUSD or XAGUSD on the D chart, the forecast automatically displays the Buy zone or Sell zone, the price targets, and the green arrow lines showing the most likely future price paths. Before major economic releases, 4CastMachine AI also moves its trading zones farther by the historical range of that release so a surprise spike does not push you into a loss.
Instead of reacting to 12:30 UTC noise, you wait for price to enter the weekly zone and form a daily reversal pattern. You protect the setup with a daily candle-close Soft Stop Loss, lock in gains at stepped targets (TP1, TP2, ...), and hold one untargeted Free Trade to ride multi-month Gold waves.
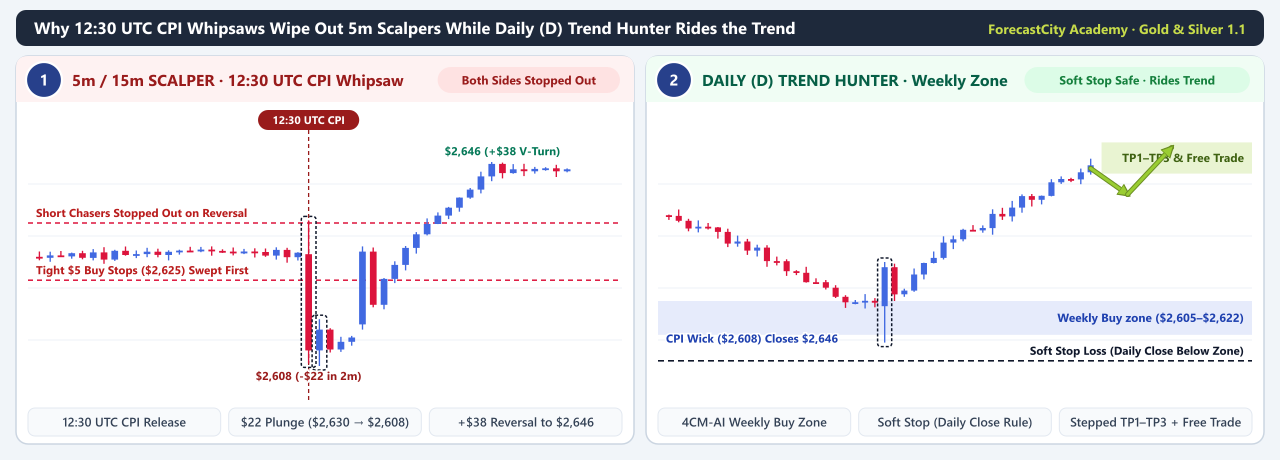
5m / 15m intraday scalper whipsaw: At
12:30UTC, the initial22-dollar drop hits tight buy stops ($2625), and the38-dollar V-reversal to$2646stops out breakout sellers minutes later.Daily (D) Trend Hunter setup: On the daily chart, the entire
CPIdrop is a single lower wick inside the weeklyBuy zoneof4CastMachine AIthat closes bullish at$2646while the daily candle-close Soft Stop Loss remains untouched.
Lessons in this course
Read the four lessons below to build a complete, low-risk trading plan for Gold and Silver. Every technical term is also defined in the Trading & Market Mechanics Glossary, and the books, institutional specifications, and studies cited in these lessons are listed together on Sources of the Academy lessons.
What moves Gold (XAUUSD) and Silver (XAGUSD) across sessions? Macro drivers, the Gold-to-Silver Ratio, and London and New York session liquidity.
How to size Gold and Silver trades without blowing your risk. Contract math, dollar value per point, and daily ATR lot sizing.
Trading XAUUSD with 4CastMachine AI zones and your entry rule. Why Gold sweeps round numbers and how to combine AI zones with daily candle confirmation.
How to test a Gold strategy on a virtual account before live. Rollover spreads, Wednesday triple swap, virtual forward testing, and journal audits.