
This quick tour shows you how to read and trade a 4CastMachine AI forecast in five practical steps across Crypto, Gold, and Forex, from checking the 8-timeframe panel to setting an automated alert or strategy.
Worked 5-step example on BTCUSD 1h (shown below): In the 4CastMachine AI panel, Weekly (W, Bullish above 48879.14) and Daily (D, Bullish above 74975.45) both point up. On the 1h chart, the forecast reads Bullish Above 78894.89 with a Buy zone from 78894.89 to S1 = 79703.62 and a Profit zone from R1 = 81295.90 to R5 = 84160.75. After price pulls back into the Buy zone and closes a bullish reversal candle, it rallies past 80537.74 toward the five stepped targets (TP1 = 81295.90, TP2 = 81968.76, TP3 = 82628.37, TP4 = 83436.66, TP5 = 84160.75), with the stop loss placed behind 78894.89 by 10% of daily ATR(264, D) plus spread and moved to Entry + 1 pip once TP1 hits.
What are the five steps to trade a forecast?
Every trade with 4CastMachine AI follows the same five steps across all timeframes, whether you are buying a bullish pullback on BTCUSD 1h or selling a bearish rally on XAUUSD 15m:
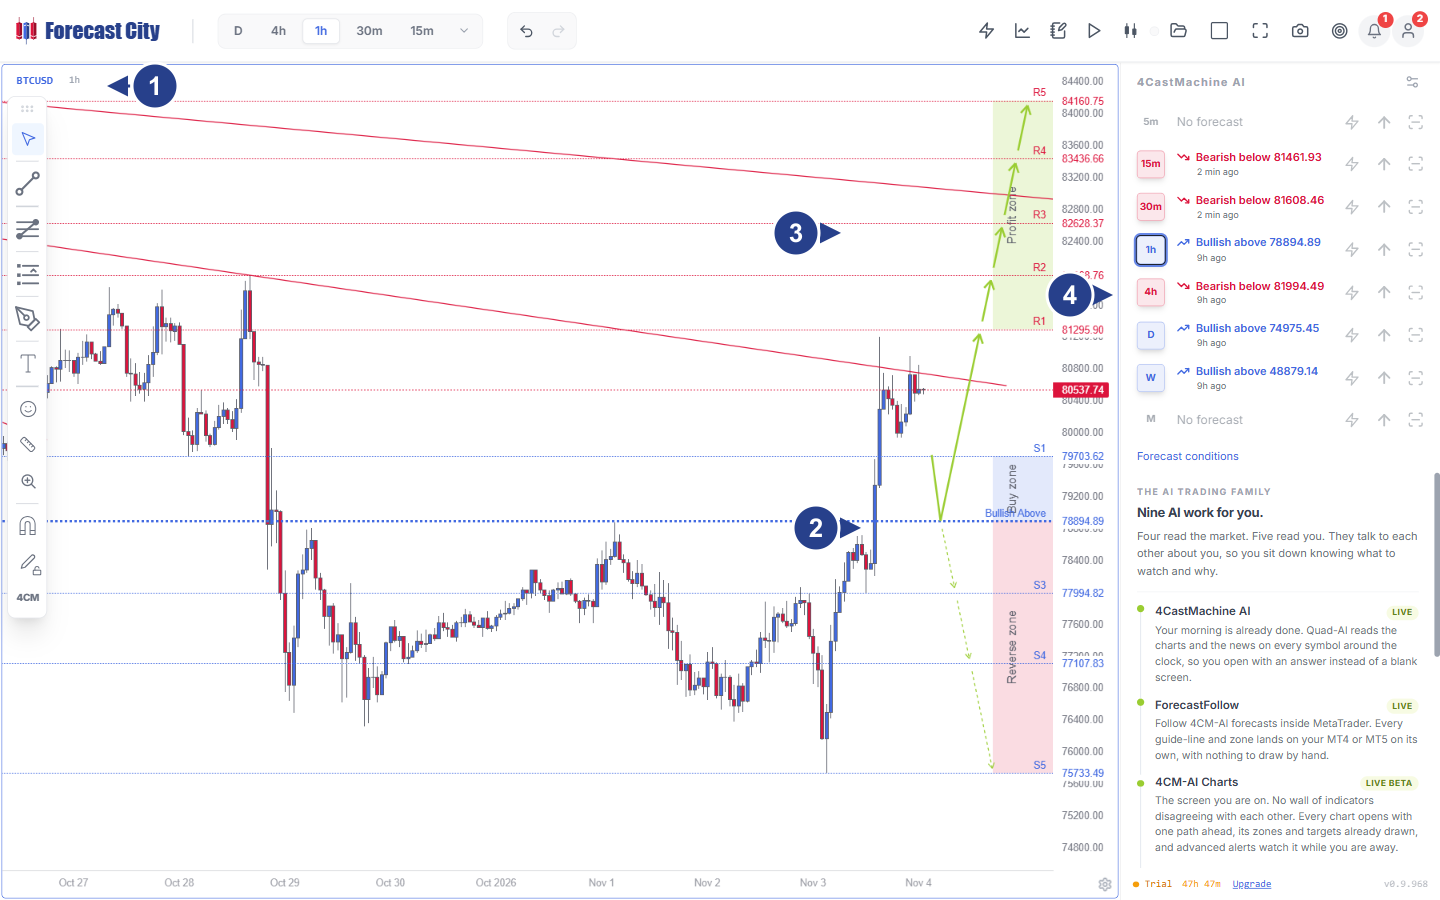
Symbol and 1h timeframe: confirms you are viewing
BTCUSDon the1hexecution chart.Buy zone (78894.89 to 79703.62) and Pivot: shaded support band above the
Bullish Above 78894.89pivot where the bullish wave launched.Main path arrows and Profit zone (R1 to R5): solid green arrows pointing to five stepped targets from
R1 = 81295.90up toR5 = 84160.75.4CastMachine AI panel (15m to W): shows
1h Bullish above 78894.89aligned withD Bullish above 74975.45andW Bullish above 48879.14.
The exact same visual structure works in reverse during a bearish setup, as shown on this full-width XAUUSD (Gold) 15m chart:
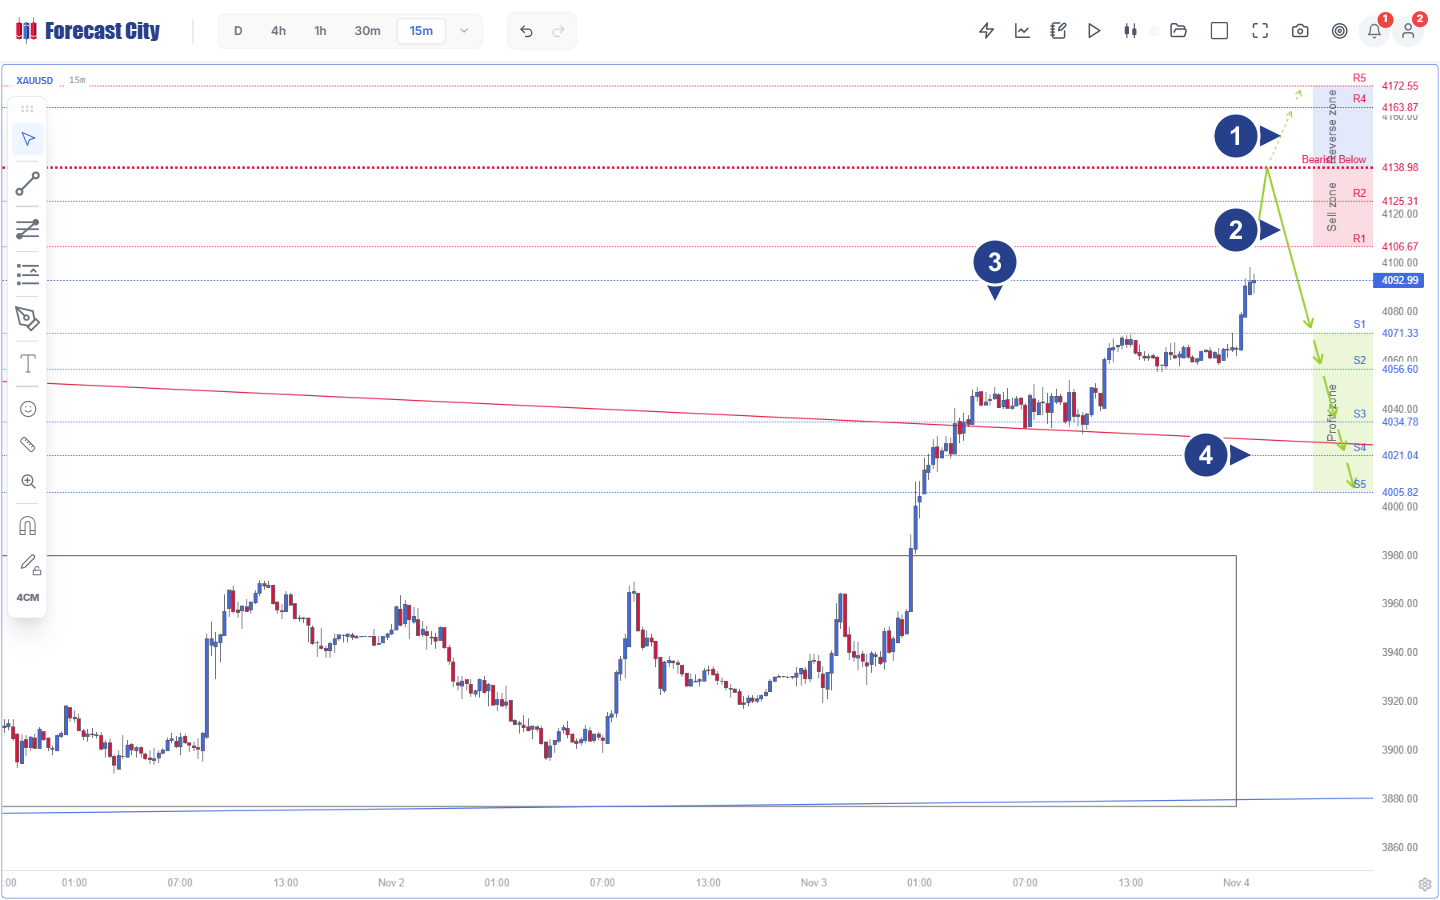
Pivot (4138.98) and Reverse zone (up to R5 4172.55): if Gold breaks above
4138.98, dashed green arrows map the upside path toR4 = 4163.87andR5 = 4172.55.Sell zone (R1 4106.67 to 4138.98): resistance band (including
R2 = 4125.31) where sellers rejected the rally.Price action and AI trend line: shows the prior consolidation box, the impulse wave, and the red AI trend line intersecting the target zone.
Stepped Profit zone targets (S1 4071.33 to S5 4005.82): solid green arrows pointing from live price (
4092.99) down toS1 = 4071.33,S2 = 4056.60,S3 = 4034.78,S4 = 4021.04, andS5 = 4005.82.
Step 1: Check the higher-timeframe compass in the panel
Before looking at your entry candle, look at the 4CastMachine AI panel on the right side of the chart. Check the row one or two steps higher than your trading timeframe (for example, on BTCUSD 1h, check D Bullish above 74975.45 and W Bullish above 48879.14).
When the higher timeframe and your trading timeframe show the same green Bullish or red Bearish direction, you are trading with the main market tide. Read Align timeframes from Monthly (M) down to 5m for the full pairing table.
Step 2: Read the pivot, arrows, and zones on your chart
On your active timeframe, read the four building blocks drawn on the candles:
Pivot price: The decision line written in the panel (such as
Bullish above 78894.89onBTCUSD 1horBearish below 4138.98onXAUUSD 15m). The forecast stays valid as long as price stays on the forecast side of this line.Buy zone or Sell zone: The shaded entry band starting at the pivot (
78894.89to79703.62onBTCUSD 1h;4106.67to4138.98onXAUUSD 15m) where a new wave or pullback entry begins.Main path (solid green arrows) and Profit zone: The expected price path leading to the five target levels (
R1 = 81295.90toR5 = 84160.75onBTCUSD 1h;S1 = 4071.33toS5 = 4005.82onXAUUSD 15m).Reverse zone and alternate path (dashed green arrows): Drawn on
4hand lower timeframes on the opposite side of the pivot. If price breaks the pivot and enters the Reverse zone (down toS5 = 75733.49onBTCUSD 1hor up toR5 = 4172.55onXAUUSD 15m), the dashed arrows show the opposite scenario.
Step 3: Wait for a confirming candle inside the zone
Why should you wait for a candle instead of entering the instant price touches a zone? Entering blindly on a fast candle can catch a falling knife that slices straight through the pivot.
Instead, wait for price to enter the zone and close a reversal candlestick pattern:
On intraday charts (5m to 4h): In a Buy zone, wait for a
HammerorBullish Engulfingcandle to close. In a Sell zone, wait for aShooting StarorBearish Engulfingcandle to close (Lesson 3).On the daily chart (D): Wait for a daily
Hammer,Valley(two-candle trough),Shooting Star, orPeak(two-candle crest) to close inside or withinATR(264, D) / 2of the zone (Lesson 4).
Step 4: Set stepped targets, stop loss, and Break-Even
Before opening the trade, define your exit and risk levels from the forecast zones and pivot:
Stepped Take Profit: On intraday charts, split your position into 5 equal parts (
20%each) at the five4CM-AItargets (TP1toTP5). On the daily (D) chart, set stepped targets at consecutive support/resistance lines and leave one order open as a Free Trade.Stop Loss: On intraday charts, place your stop loss behind the
4CM-AIpivot by10%of dailyATR(264, D)plus spread. On the daily (D) chart, use a Soft Stop Loss that closes only if a healthy daily candle closes outside the zone.Break-Even rule: As soon as
TP1is touched on an intraday trade (such as81295.90onBTCUSD 1hor4071.33onXAUUSD 15m), move the stop loss of the remaining orders toEntry + 1 pip(orEntry - 1 pipon a Sell) so your trade cannot lose money.
Step 5: Automate with alerts, AI Strategy Studio, or Virtual account
You never need to sit in front of the monitor waiting for price to reach a zone. Click the lightning icon in the 4CastMachine AI panel to set a zone alert, or open Automate forecasts with alerts, AI, and risk rules to run the built-in 4CastMachine AI strategy on a Virtual account or real account.
Where do I go next?
Open the Step-by-step guide to follow all seven lessons in order, or jump directly to Lesson 1: What a forecast is, Quad-AI, and why not signals.