
A single candle on a 15m chart shows 15 minutes of trading, whereas a single candle on the Daily (D) chart shows 96 of those 15-minute candles combined. When you align your execution timeframe with the higher-timeframe forecast in the 4CastMachine AI panel, you stop fighting institutional trends and trade with the main tide of the market.
This lesson gives you a top-down pairing table from Monthly (M) down to 5 minutes (5m), walks through two live multi-timeframe alignments on ETHUSD (Ethereum) and EURUSD, shows how to project higher-timeframe support and resistance onto your chart, and explains how to use the eight proprietary 4X currency strength indices.
Two live multi-timeframe examples (ETHUSD and EURUSD): On ETHUSD 1h (shown below), Weekly (W Bullish above 2107.02) and Daily (D Bullish above 2154.27) both point up. Even while 4h is in a wider pullback (Bearish below 2478.12), price bounced from the 1h Buy zone (2339.49 to S1 = 2391.19), flipped 1h (Bullish above 2339.49) and 15m (Bullish above 2387.22) back into alignment with D and W, and broke above the red trend lines toward the 1h Profit zone (R1 = 2449.13 to 2624.05). On EURUSD, six timeframes align upward at once: W Bullish above 1.09560, 4h Bullish above 1.11130, 1h Bullish above 1.12060, 30m Bullish above 1.12130, 15m Bullish above 1.12140, and 5m Bullish above 1.12200.
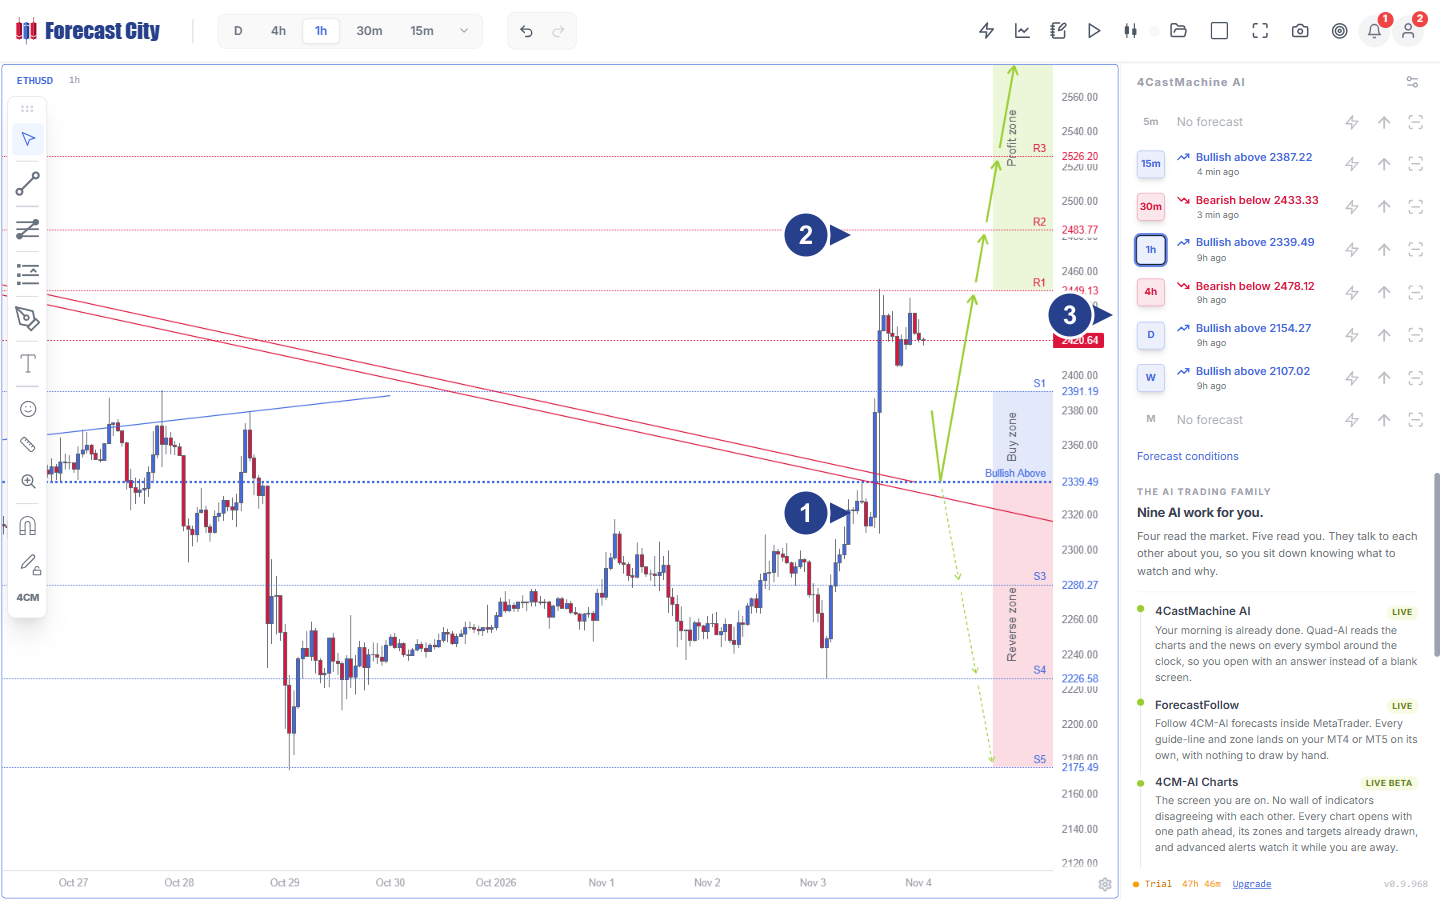
ETHUSD 1h Buy zone (2339.49 to 2391.19) and Pivot: price held above the
Bullish Above 2339.49pivot inside the2339.49–2391.19support band and broke through the two red resistance trend lines.1h Profit zone targets (2449.13 to 2624.05): solid green arrows point from live price (
2420.64) into the Profit zone atR1 = 2449.13,R2 = 2483.77,R3 = 2526.20, and up to2624.05.Aligned W, D, and 1h Bullish rows vs 4h pullback: in the 4CastMachine AI panel,
W(Bullish above 2107.02),D(Bullish above 2154.27),1h(Bullish above 2339.49), and15m(Bullish above 2387.22) all point up, while4h(Bearish below 2478.12) marks the overhead resistance ceiling nearR2 = 2483.77.
Which compass and execution timeframes should I pair?
You do not need to check all eight timeframes on every trade. Pick the row that matches your trading style in the table below, use the Compass Timeframe to set your direction, and use the Execution Timeframe (4 to 6 times lower) to time your entry zone and candle:
| Trading style | Compass timeframe (Direction & major walls) | Structure timeframe (Wave context) | Execution timeframe (Entry zone, candle & stop) |
|---|---|---|---|
| Position trading | M and W |
W |
D (Trend Hunter Strategy) |
| Swing trading | W and D |
D |
4h or 1h (4CastMachine AI strategy) |
| Day trading | D and 4h |
1h |
30m or 15m (4CastMachine AI strategy) |
| Scalping | 4h and 1h |
15m |
5m on Forex / 15m on Crypto, Metals & Indices |
How do I read all 8 rows of the panel together?
When you glance at the 4CastMachine AI panel from bottom (M, W, D) to top (4h, 1h, 30m, 15m, 5m), you will see one of three market states:
Full intraday-to-weekly alignment (such as EURUSD from 5m to W): When
W(Bullish above 1.09560),4h(Bullish above 1.11130),1h(Bullish above 1.12060),30m(Bullish above 1.12130),15m(Bullish above 1.12140), and5m(Bullish above 1.12200) all point in the same direction, you have maximum multi-timeframe tailwind. Trade the Buy zone on your execution timeframe and hold toward all five stepped targets (TP1toTP5).Pullback inside a higher uptrend (such as BTCUSD or ETHUSD above): On
BTCUSD, Weekly (Bullish above 48879.14), Daily (Bullish above 74975.45), and1h(Bullish above 78894.89) are allBullish, while15m(Bearish below 81461.93) and30m(Bearish below 81608.46) show a short-term pullback. Wait for that short-term pullback to reach the1hBuy zone (78894.89–79703.62) and close a bullish reversal candle so you buy the dip in the direction ofDandW.Counter-trend trade into a higher-timeframe ceiling: On
ETHUSD 1habove, while1hisBullish above 2339.49, the4hrow readsBearish below 2478.12(just below1h R2 = 2483.77). Knowing that2478.12is the4hpivot reminds you to lock in partial profits atR1 = 2449.13and move your stop toBreak-Evenbefore price tests the2478.12wall.
How do I overlay higher-timeframe S/R and trend lines on my chart?
A 15m rally will often stall abruptly at a price level that looks empty on the 15m chart, because price just hit a major 4h or Daily resistance wall (4h R1 or D R1). You can display those higher-timeframe walls directly on your execution chart in two ways:
Click any row in the 4CastMachine AI panel: While viewing a
15mor1hchart, click the4horDrow in the side panel. A ring appears around that timeframe and its support, resistance, and trend lines draw onto your chart. Click the row again to hide them.Turn on permanent higher-timeframe layers in Settings: Open chart Settings... (first tab) and tick Higher TF Support & Resistance and Higher TF Trend Lines. Each line is labeled with its timeframe prefix (such as
D S1,D R1, orW S1) so you never trade blindly into a higher-timeframe wall.
How do I use the 8 proprietary 4X currency strength indices?
In Forex, every pair is a tug-of-war between two currencies. If both EUR and USD are equally strong today, EURUSD will chop sideways inside a noisy range.
To help you find the cleanest trends, ForecastCity forecasts eight dedicated 4X currency strength indices across all eight timeframes (5m to M): USD4X, EUR4X, GBP4X, JPY4X, AUD4X, CAD4X, CHF4X, and NZD4X:
Check the strongest 4X index in Symbol Search or Watchlists: Look for a currency index that is
Bullishacross multiple timeframes, for example whenEUR4Xreads4h Bullish above 2.3324,1h Bullish above 2.3397, and15m Bullish above 2.3407.Find the weakest counterpart: Look for a currency index that is
Bearishacross the same timeframes, for example whenUSD4Xreads4h Bearish below 2.0967,1h Bearish below 2.0853, and15m Bearish below 2.0846.Trade the cross pair: Because
EUR4Xis rising above2.3397whileUSD4Xis falling below2.0853, both currencies pushEURUSDupward (1h Bullish above 1.12060, Buy zone1.12060–1.12180, Profit zone1.12510–1.13680). Pairing the strongest currency index against the weakest puts institutional flow on both sides of your trade.
Where do I go next?
Next, open Lesson 6: How often forecasts update and stay valid to learn the analysis schedule for every timeframe, why forecasts have no clock expiration, and what triggers a new forecast.