
Intraday forecasts on 5m, 15m, 30m, 1h, and 4h let scalpers and day traders catch fast session moves across Forex, Gold, and Crypto with clear structure. However, trading an intraday forecast requires a strict two-step rule: you never enter blindly the instant price touches a zone. Instead, you wait for price to pull back into the zone and close a confirming reversal candle.
This lesson teaches the complete, official 4CastMachine AI strategy for intraday timeframes, including its candle triggers, five stepped targets (TP1 to TP5), ATR(264, D) stop-loss buffer, Break-Even rule, and Reverse zone alternate path.
Two live intraday examples (Gold 15m and Bitcoin 1h): On XAUUSD 15m (seen in the Quick Tour), the forecast reads Bearish Below 4138.98 with a Sell zone from R1 = 4106.67 to 4138.98. After price rallies into the Sell zone and closes a bearish reversal candle, you open a Sell trade, split your position into 5 equal parts (20% each) at TP1 = 4071.33 (S1), TP2 = 4056.60 (S2), TP3 = 4034.78 (S3), TP4 = 4021.04 (S4), and TP5 = 4005.82 (S5), place your stop loss above 4138.98 by 10% of daily ATR(264, D) plus spread, and move the remaining 80% to Entry - 1 pip once TP1 (4071.33) is touched. On BTCUSD 1h (Bullish Above 78894.89), after a bullish candle closes inside the Buy zone (78894.89 to S1 = 79703.62), you buy toward TP1 = 81295.90 (R1) through TP5 = 84160.75 (R5) with your stop behind 78894.89.
Why must you wait for a candle inside an intraday zone?
On intraday charts (5m to 4h), economic releases, session opens, and institutional order sweeps can push price into a support or resistance band with heavy momentum. If you place a blind limit order at the top edge of a Buy zone (such as 1.12180 on EURUSD 1h or 79703.62 on BTCUSD 1h), a single fast red candle can fill your order and keep falling straight through the pivot.
Waiting for a reversal candlestick pattern to close inside the zone proves two things before you risk your money:
Counter-trend momentum has exhausted its push: The pullback actually slowed down and stopped inside the band between the zone boundary and the Pivot (such as between
1.12180and1.12060onEURUSD 1h).Institutional orders have stepped in with real volume: A rejection wick (
HammerorShooting Star) or a full engulfing body (Bullish EngulfingorBearish Engulfing) confirms that buyers or sellers are defending the zone in the direction of the solid green arrows.
What are the exact rules of the 4CastMachine AI strategy?
The built-in 4CastMachine AI strategy in AI Strategy Studio applies four precise rules on 5m, 15m, 30m, 1h, and 4h:
| Strategy part | Bullish forecast (Buy setup, e.g. EURUSD 1h or BTCUSD 1h) | Bearish forecast (Sell setup, e.g. XAUUSD 15m or BTCUSD 4h) |
|---|---|---|
| 1. Entry setup (Zone + Candle) | Price enters the 4CM-AI Buy zone (1.12060–1.12180 on EURUSD 1h; 78894.89–79703.62 on BTCUSD 1h) and closes a bullish Hammer or Bullish Engulfing candle. |
Price enters the 4CM-AI Sell zone (4106.67–4138.98 on XAUUSD 15m; 79720.46–81994.49 on BTCUSD 4h) and closes a bearish Shooting Star or Bearish Engulfing candle. |
| 2. Stepped Take Profit (TP1–TP5) | Split the position into 5 equal steps of 20% each at the five bullish targets (R1 = 1.12510 to R5 = 1.13680 on EURUSD 1h; R1 = 81295.90 to R5 = 84160.75 on BTCUSD 1h). |
Split the position into 5 equal steps of 20% each at the five bearish targets (S1 = 4071.33 to S5 = 4005.82 on XAUUSD 15m; S1 = 78882.46 to S5 = 72037.14 on BTCUSD 4h). |
| 3. Stop Loss (Pivot + ATR buffer) | Place the stop loss below the 4CM-AI Pivot (1.12060 or 78894.89) by 10% of daily ATR(264, D) plus the symbol's spread. |
Place the stop loss above the 4CM-AI Pivot (4138.98 or 81994.49) by 10% of daily ATR(264, D) plus the symbol's spread. |
| 4. Management (Break-Even at TP1) | As soon as TP1 (R1) is touched, move the stop loss of the remaining 80% position to Entry + 1 pip. |
As soon as TP1 (S1) is touched, move the stop loss of the remaining 80% position to Entry - 1 pip (1 pip in profit). |
How do I spot Hammer, Shooting Star, and Engulfing candles?
You only need two classic reversal patterns inside the zone:
Hammer (in a Buy zone): A candle with a long lower wick (at least twice the size of its body) and a small body near the top of the candle. The long lower wick shows that sellers tried to push price toward the pivot, but buyers rejected the drop and closed the candle back up inside the Buy zone.
Shooting Star (in a Sell zone): The mirror image of a Hammer inside a resistance band: a long upper wick (at least twice the body) and a small body near the bottom, showing that buyers failed to break the Sell zone.
Bullish or Bearish Engulfing: A two-candle pattern where the second healthy candle opens and closes in the forecast direction with a solid body that completely covers (engulfs) the body of the previous pullback candle.
Why is the stop loss placed 10% of ATR(264, D) behind the pivot?
The Pivot is the exact outer edge of the Buy zone or Sell zone. If you place your stop loss right on the pivot line (with zero buffer), a momentary 2-pip liquidity sweep or a brief spread widening can stop you out right before price rallies to TP5.
Using 10% of daily ATR(264, D) plus spread adapts your stop buffer to the true volatility of each market:
Forex example on EURUSD 1h (Pivot 1.12060): When daily
ATR(264, D)is0.00700(70pips) and the spread is0.00010(1.0pip),10%ofATR(264, D)is7pips. Your stop loss sits8pips below the1.12060pivot at1.11980.Gold example on XAUUSD 15m (Pivot 4138.98): When daily
ATR(264, D)is$45.00and the spread is$0.25,10%ofATR(264, D)is$4.50. Your stop loss sits$4.75above the4138.98bearish pivot at4143.73.Crypto example on BTCUSD 1h (Pivot 78894.89): When daily
ATR(264, D)is$2,800.00and the spread is$15.00,10%ofATR(264, D)is$280.00. Your stop loss sits$295.00below the78894.89bullish pivot at78599.89.
How do I use the Reverse zone and dashed arrows on 4h and below?
On 4h, 1h, 30m, 15m, and 5m, 4CastMachine AI draws a Reverse zone on the opposite side of the pivot with dashed green arrows pointing to the alternate targets (such as S3 = 1.11740 to S5 = 1.11360 below 1.12060 on EURUSD 1h, or R3 = 81967.61 to R5 = 83038.55 above 81461.93 on BTCUSD 15m).
When price breaks through the Pivot and closes a healthy candle inside the Reverse zone:
The main forecast is finished: Do not look for new trades in the old direction.
The alternate path becomes active: The dashed green arrows show the new direction and its target levels until the engine publishes the next refreshed forecast row.
How do I load this strategy in one click?
In AI Strategy Studio, click Start from your trading style, pick Day trading (or Scalping / Swing trading), and select 4CastMachine AI strategy. The studio loads the zone entry, candle confirmation, TP1–TP5 (20% each), ATR(264, D) pivot stop, and Break-Even at TP1 onto your chart:
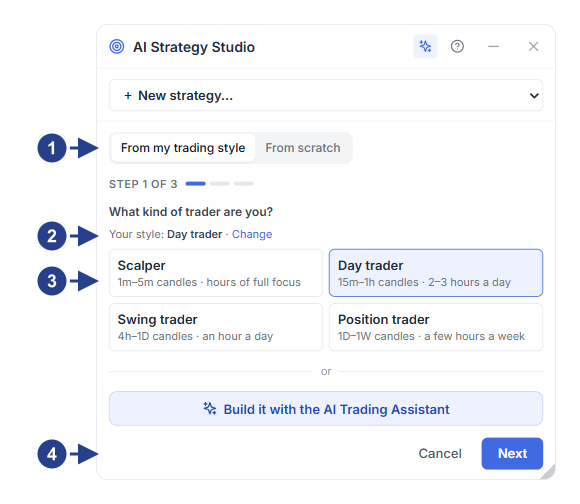
Trading style selector: Pick Scalping (
5m), Day trading (15mto1h), or Swing trading (4htoD).Starting template list: Choose 4CastMachine AI strategy to load all four intraday rules at once.
Strategy sentence preview: Read the complete colored rule sentence before saving or testing on past candles.
Where do I go next?
Next, open Lesson 4: Daily, Weekly, and Monthly forecasts (D, W, M) to see how higher-timeframe forecasts work and how the Trend Hunter Strategy catches multi-week waves on the daily chart.