
In ForecastCity, the 4CastMachine AI engine publishes visual price roadmaps across eight timeframes, from Monthly (M) down to 5 minutes (5m), on 125 symbols in Forex, Cryptocurrencies, Commodities, and Indices.
This course shows you how to read every line and zone on your chart, how to trade intraday pullbacks on 5m to 4h with the 4CastMachine AI strategy, how to trade major daily waves on D, W, and M with the Trend Hunter Strategy, and how to let AI watch the market for you.
Open any supported symbol on 4CM-AI Charts to see its live arrows, pivot, and zones across all eight timeframes (5m, 15m, 30m, 1h, 4h, D, W, and M) right beside the price candles.
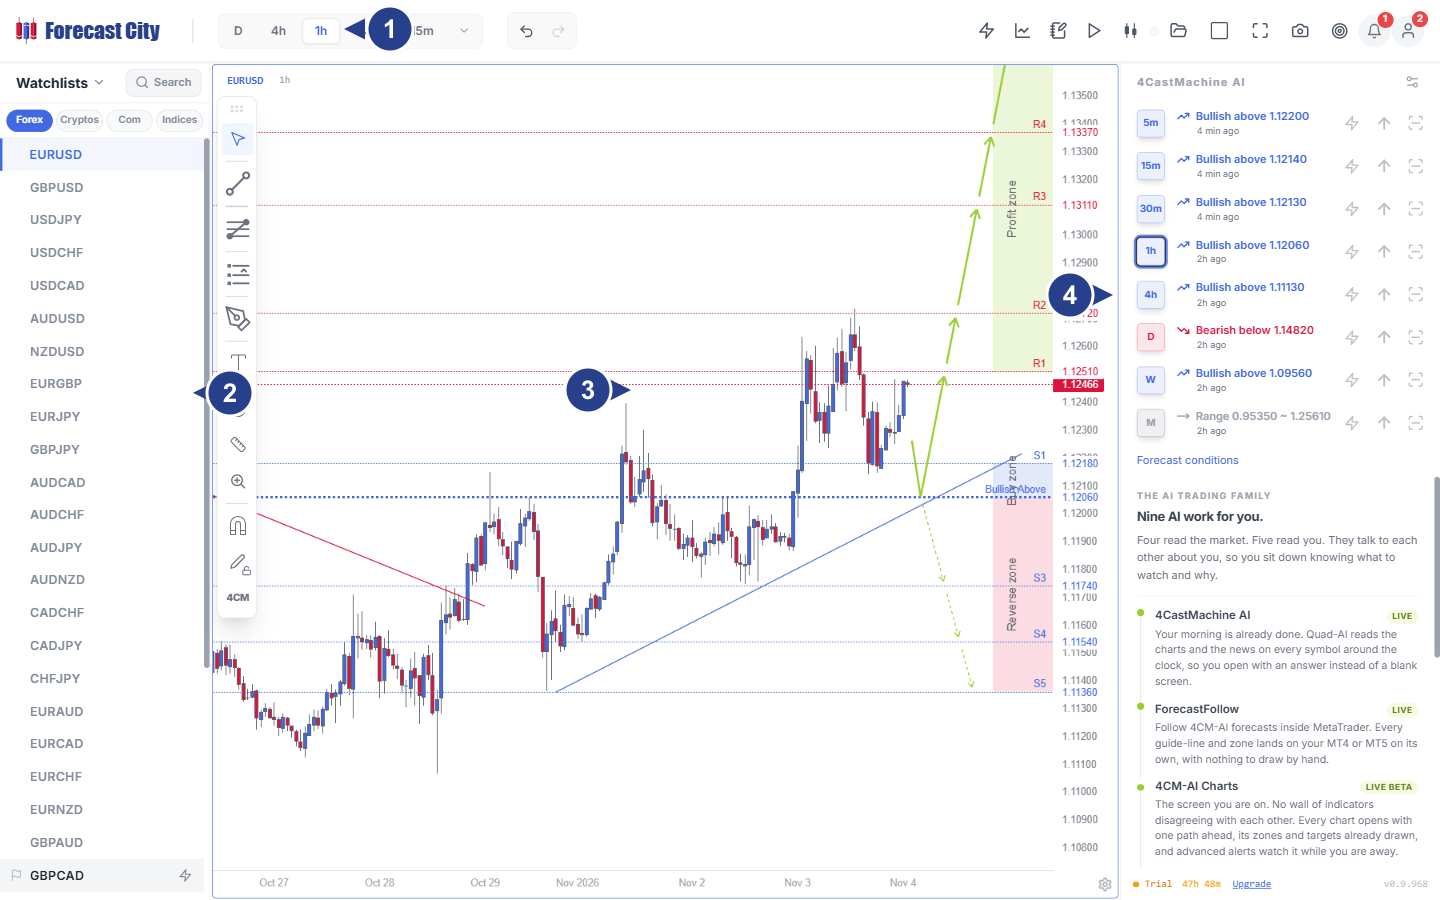
Top timeframe toolbar: switch timeframes from
5mtoM, open Alerts, Indicators, or Replay, or click Take snapshot.Left drawing toolbar (4CM): pick trend lines, Fibonacci tools, position calculators, or the Measure ruler (press
Shift+Sto hide the left Watchlists panel for a wider chart).Active chart forecast zones and arrows: on
EURUSD 1h(Bullish Above 1.12060), price bounced from the Buy zone (1.12060toS1 = 1.12180) along the solid green arrows toward the Profit zone (R1 = 1.12510toR4 = 1.13370), while the pink Reverse zone below1.12060maps the alternate path down toS5 = 1.11360.4CastMachine AI multi-timeframe panel: lists the live direction and pivot for every timeframe from
5m(Bullish above 1.12200) toW(Bullish above 1.09560) andM(Range 0.95350 ~ 1.25610).
What makes a 4CastMachine AI forecast different?
Instead of sending a blind Buy or Sell message at a single price, 4CastMachine AI draws the full structure of the market on your chart before you risk a dollar:
Four AI engines in one roadmap: The Quad-AI pipeline combines technical wave structure (
Forecast AI) and macroeconomic news sentiment (Sentiment AI) into one unified path.Clear entry, target, and invalidation zones: Every forecast marks where to look for an entry (Buy zone or Sell zone), where to take stepped profit, and which pivot price flips the scenario into the Reverse zone.
Two complete strategies for every timeframe: On intraday charts (
5mto4h), you trade trend pullbacks with the 4CastMachine AI strategy. On the daily (D) chart, you catch multi-week waves with the Trend Hunter Strategy.Zero screen-staring required: You can turn any forecast zone or strategy into 24/7 alerts, test it on past candles in AI Strategy Studio, or run it live with virtual money on a Virtual account.
When you want maximum chart space to inspect candlesticks and support/resistance lines, press Shift+S (to close Watchlists) and Shift+4 (to close the right panel), as shown on this full-width BTCUSD 4h bearish forecast:
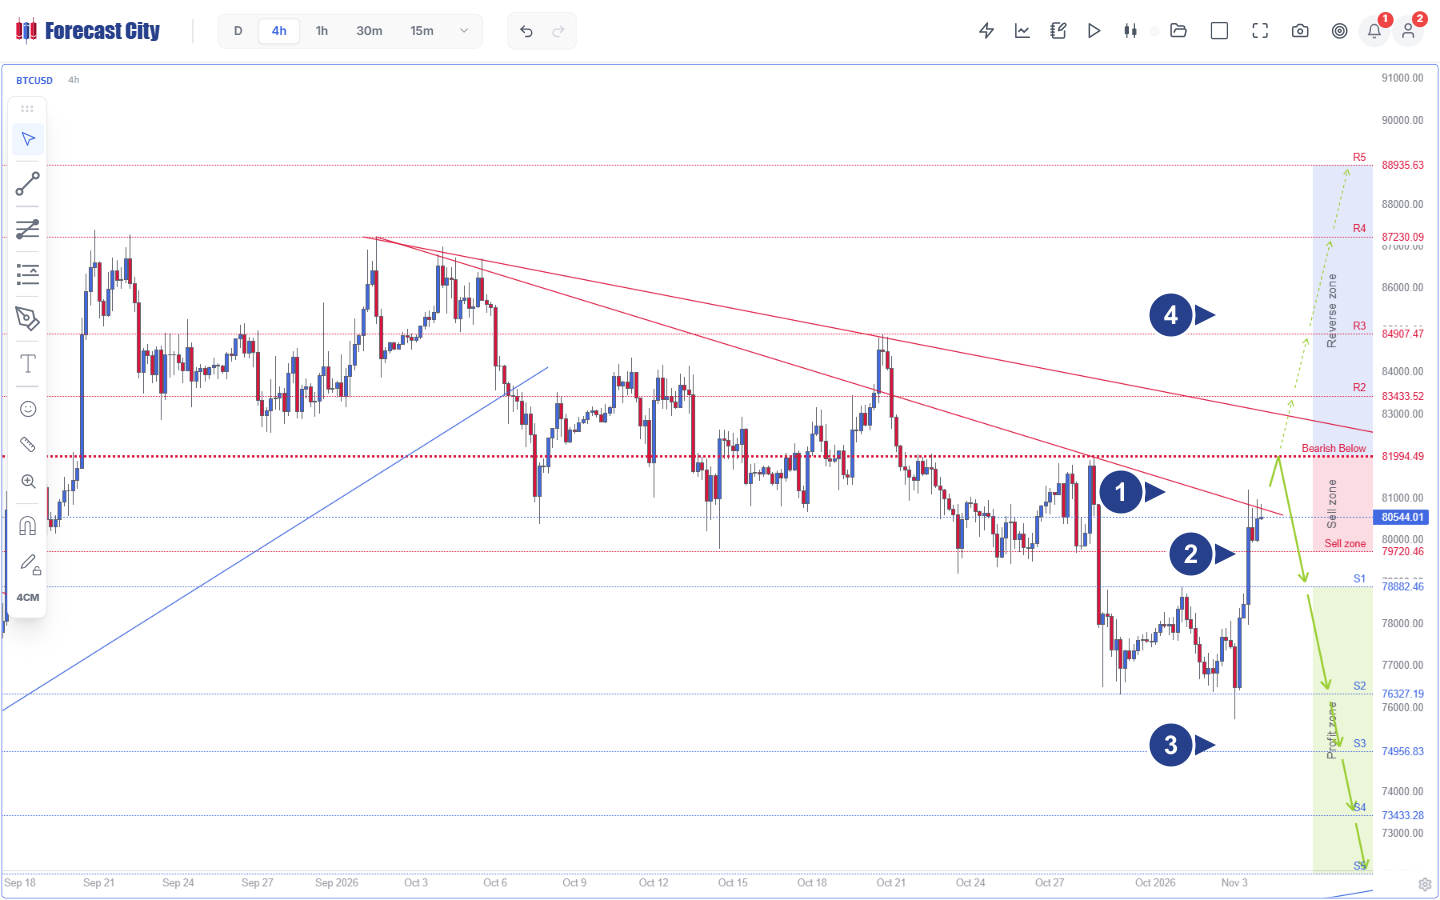
Bearish Below 81994.49 pivot: the invalidation line at the top edge of the Sell zone.
Sell zone (79720.46 to 81994.49): shaded resistance band where
BTCUSD(trading at80544.01) tests the red AI resistance trend line.Main path and Profit zone (S1 to S5): solid green arrows pointing down to five stepped targets from
S1 = 78882.46,S2 = 76327.19,S3 = 74956.83, andS4 = 73433.28down toS5 = 72037.14.Alternate path and Reverse zone (R2 to R5): if price breaks above
81994.49, dashed green arrows map the upside path toR2 = 83433.52,R3 = 84907.47,R4 = 87230.09, andR5 = 88935.63.
How do forecasts work from Monthly down to 5m?
Every timeframe in the 4CastMachine AI panel has a distinct job in your trading plan. Higher timeframes show the dominant tide of institutional money, and lower timeframes pinpoint your entry candle and stop loss:
| Timeframe group | Timeframes | Main job in your trading plan |
|---|---|---|
| Macro & Position | M, W |
Shows multi-month direction and major historical support and resistance floors and ceilings. |
| Daily Swing (Trend Hunter) | D |
Updated every Saturday as Weekly Forecasts. Maps the start and continuation of major daily waves. |
| Intraday Structure | 4h, 1h |
Bridges the daily trend and session swings. Maps intraday Buy, Sell, Profit, and Reverse zones. |
| Intraday Execution & Scalping | 30m, 15m, 5m |
Pinpoints fast pullback entries with tight stops behind the 4CM-AI pivot during active sessions. |
How this course helps you at your current stage?
New to ForecastCity: Start with the 5-step Quick Tour and the chart-reading lesson so every arrow, shaded zone, and panel row makes sense in minutes.
Intraday or scalp trader (5m to 4h): Study Lesson 3 and Lesson 5 to combine higher-timeframe direction with the 4CastMachine AI strategy (zone pullback + candle confirmation + 5 stepped targets).
Part-time or swing trader (D, W, M): Study Lesson 4 to run the 15-minute Saturday routine on the daily (
D) chart without watching screens during the workweek.Already have your own strategy: Use the 8-timeframe forecast panel as a directional filter and automate your rules in AI Strategy Studio and ForecastFollow.
Start here
Quick tour: read and trade a forecast in 5 steps. Walk through the whole workflow from checking the 8-timeframe panel to setting your alert or strategy on one page.
Step-by-step guide: master forecasts in order. Follow the seven core lessons in order, or use the quick-reference lookup table to jump straight to any rule.