
While intraday forecasts (5m to 4h) map session pullbacks, the Daily (D), Weekly (W), and Monthly (M) forecasts map the big institutional waves that last from several weeks to several months. Even if you trade on a 15m or 1h chart, the D, W, and M rows in the 4CastMachine AI panel serve as your master directional compass.
This lesson explains how D, W, and M forecasts are structured on Crypto and Forex charts, how Saturday Weekly Forecasts work on the daily (D) chart, and how the Trend Hunter Strategy trades them with only 15 minutes of weekend chart selection.
Two daily (D) examples across Crypto and Forex: On BTCUSD D (shown first below), the daily forecast published on 2026.11.01 reads Forecast: Continuation of Up Trend (Bullish above 74975.45 in the side panel, aligned with W Bullish above 48879.14). The wave launched from the daily Buy zone (57813.38 to 61630.15) after bullish divergence (Div) and a Buy trigger, climbed through TP1 = 67248.00, TP2 = 74975.45, TP3 = 78589.43, and TP4 = 82427.54, and maps the remaining Profit zone up to TP5 = 89051.47. On EURJPY D (shown second below), a daily Buy setup in the Buy zone banked 9355 pips across 10 stepped targets and 3330 pips on the 11th Free Trade (12685 pips total).
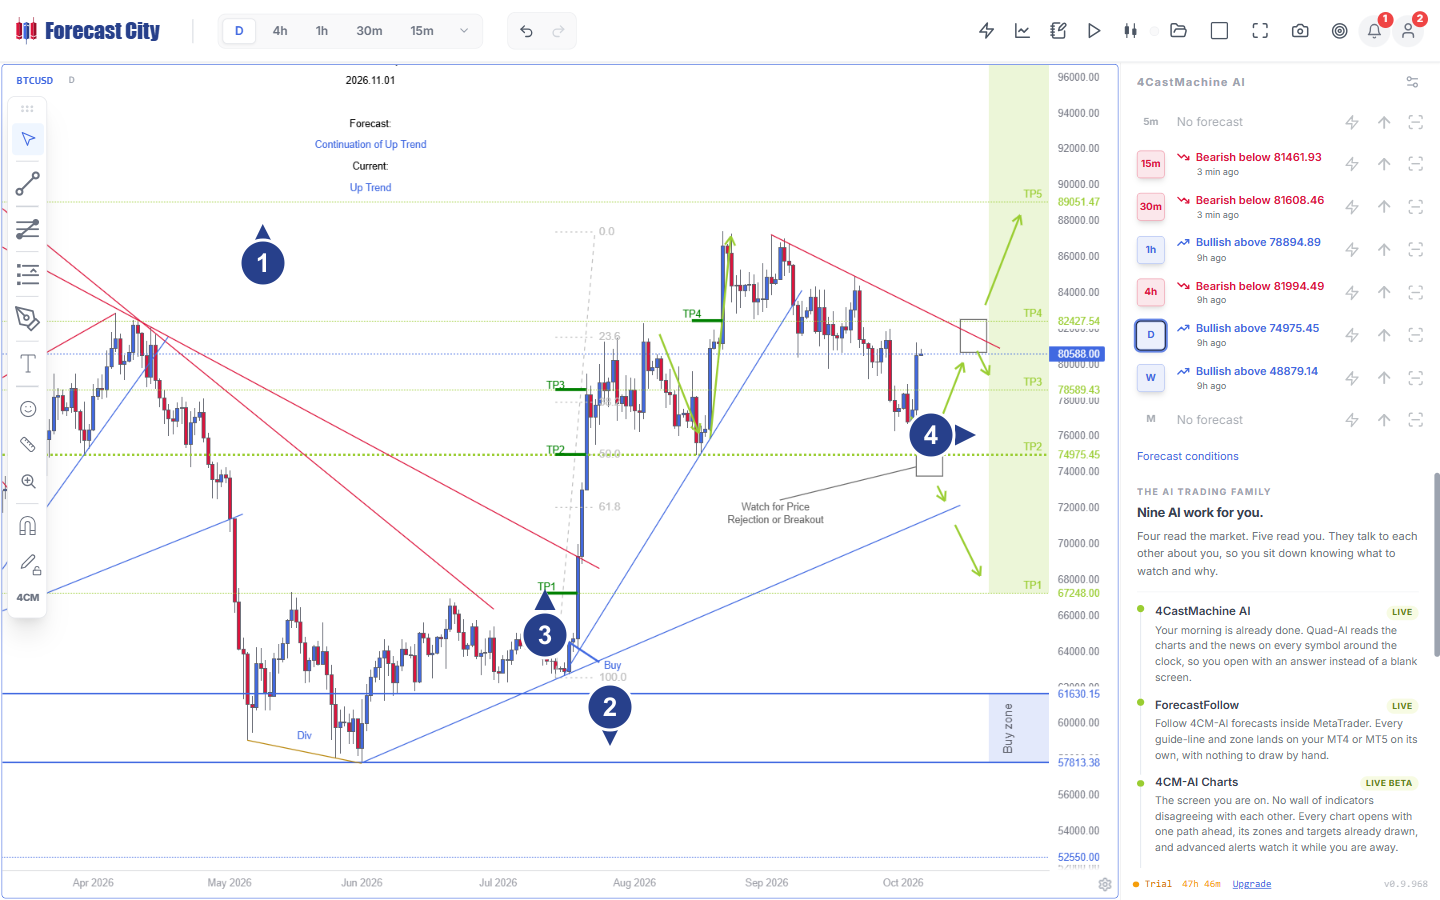
Continuation of Up Trend status: header showing the Saturday publication date (
2026.11.01),Forecast: Continuation of Up Trend, andCurrent: Up Trend.Daily Buy zone (57813.38 to 61630.15) and Divergence: the shaded support floor where bullish divergence (
Div) and theBuysetup started the multi-month wave.Stepped breakout targets (TP1 to TP4): green target lines at
TP1 = 67248.00,TP2 = 74975.45,TP3 = 78589.43, andTP4 = 82427.54reached along the daily uptrend.Watch for Price Rejection or Breakout boxes and Daily Profit zone: marks the decision boxes at the red resistance trend line and the active Profit zone from
TP1 = 67248.00toTP5 = 89051.47(with theDrow in the right panel readingBullish above 74975.45).
When you catch a daily wave right at its start inside the Buy zone, the Trend Hunter Strategy banks stepped profits along the wave and holds one untargeted order until the trend finishes:
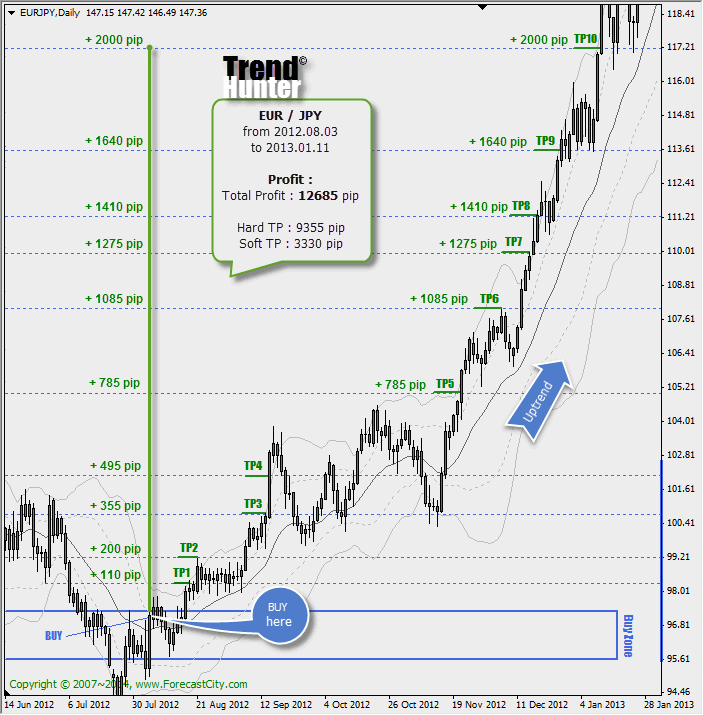
Daily Buy zone: shaded support band where the new multi-month uptrend began after a daily reversal pattern.
Stepped Take Profit targets: ten consecutive resistance targets that locked in
9355pips along the wave.Free Trade exit: the 11th order held with no fixed target until the daily trend ended for an extra
3330pips.
How do Daily (D), Weekly (W), and Monthly (M) forecasts differ?
Each of the three higher timeframes covers a wider horizon of institutional capital:
| Timeframe | One candle covers | Typical wave duration | How traders use it |
|---|---|---|---|
| Daily (D) | 1 trading day (17:00 to 17:00 NY on Forex/Metals; 00:00 UTC on Crypto) |
2 weeks to 4 months | Primary chart for the Trend Hunter Strategy (Saturday Weekly Forecasts) and the main trend compass for 4h and 1h swing traders (such as BTCUSD D Bullish above 74975.45). |
| Weekly (W) | 1 trading week (5 daily candles on Forex, 7 on Crypto) | 2 months to 1 year | Identifies major multi-month trend direction and macro support/resistance walls (such as BTCUSD W Bullish above 48879.14 or EURUSD W Bullish above 1.09560). |
| Monthly (M) | 1 calendar month | 6 months to multi-year cycles | Shows historical cycle floors, ceilings, and macro ranges (such as EURUSD M Range 0.95350 ~ 1.25610) for long-term position traders. |
What is the difference between Beginning and Continuation of a Trend on D?
Every Saturday while the market is closed, 4CastMachine AI updates all daily (D) Weekly Forecasts. When you open a symbol on the D chart, you will see one of two forecast states:
Beginning of Up/Down Trend (active Buy zone or Sell zone): Draws an active entry zone (Buy zone or Sell zone) and a Profit zone connected by solid green arrows. This is where you look for a new daily trade.
Continuation of Up/Down Trend (price already in the Profit zone, as on BTCUSD D above): Appears when the daily wave already started from its entry zone (
57813.38–61630.15onBTCUSD D) and is now progressing through its Profit zone (TP1 = 67248.00toTP5 = 89051.47) withWatch for Price Rejection or Breakoutboxes at key trend lines. Traders who entered in the Buy zone use these levels to manage their open orders, while new traders drop to1hor4h(such asBTCUSD 1h Bullish above 78894.89) to trade intraday pullbacks in the direction of the daily trend.
How do intraday (4CM-AI) and daily (Trend Hunter) rules compare?
Because a single daily (D) candle represents 24 hours of institutional order flow, the daily Trend Hunter Strategy uses different entry, target, and stop rules than the intraday 4CastMachine AI strategy:
| Rule category | Intraday 4CastMachine AI strategy (5m to 4h) | Daily Trend Hunter Strategy (D) |
|---|---|---|
| Entry zone | 4CM-AI Buy zone or Sell zone (plus a Reverse zone on the other side of the pivot). |
Daily Buy zone or Sell zone at the Beginning of a Trend (or within ATR(264, D) / 2 near the zone when daily DTO confirms). |
| Confirming candle pattern | Hammer or Bullish Engulfing (Buy); Shooting Star or Bearish Engulfing (Sell). |
Daily Hammer or two-candle Valley (Buy); daily Shooting Star or two-candle Peak (Sell), plus the Monday entry rule. |
| Take Profit structure | 5 equal steps (20% each at TP1 to TP5). |
Stepped orders at consecutive S/R levels (TP1, TP2, TP3, ...) plus one untargeted Free Trade held until trend end. |
| Stop Loss rule | Hard stop behind the 4CM-AI pivot by 10% of ATR(264, D) plus spread. |
Soft Stop Loss: close only if a healthy daily candle closes with at least 80% of its body outside the zone/pivot. |
| Break-Even trigger | Move stop to Entry + 1 pip as soon as TP1 is touched. |
Move all remaining orders to Break-Even once TP1 hits or price crosses daily WEMA-21. |
Why do Trend Hunter History lines appear only on D and above?
When you turn on Show Trend Hunter History in chart settings, the chart draws historical green guide-lines (labeled 4U for uptrends and 4D for downtrends) showing past Trend Hunter Strategy waves since 2015.
Because the Trend Hunter Strategy is designed specifically for daily (D) and higher timeframes, those historical guide-lines are displayed only on D, W, and M charts. When you switch your chart to 4h or lower, they hide automatically so your intraday workspace stays clean.
Where do I go next?
To study every daily rule in detail, bookmark the full Trend Hunter Strategy (V2) Academy Course. Next in this course, open Lesson 5: Align timeframes from Monthly (M) down to 5m to combine higher and lower timeframes in one workflow.