
A 4CastMachine AI forecast is a complete price roadmap drawn directly on your chart. It shows the expected direction of the next wave, the shaded entry band, the stepped profit targets, the decision price that keeps the forecast valid, and the alternate scenario if that price breaks.
This lesson explains what a forecast shows on Forex, Crypto, and Gold charts, how the four engines of Quad-AI build it, and why we publish forecasts, not signals.
Two live examples (Forex and Crypto): On EURUSD 1h (shown below), price trades at 1.12466 inside a forecast that reads Bullish Above 1.12060, with a Buy zone from 1.12060 to S1 = 1.12180, a Profit zone from R1 = 1.12510 to R5 = 1.13680, and a pink Reverse zone below 1.12060 down to S5 = 1.11360. On BTCUSD 1h, the forecast reads Bullish Above 78894.89, with a Buy zone from 78894.89 to S1 = 79703.62, a Profit zone from R1 = 81295.90 to R5 = 84160.75, and a Reverse zone below 78894.89 down to S5 = 75733.49. Before you risk a cent on either market, both scenarios are mapped in front of you.
What are the four parts of every forecast?
Every active forecast on 4CM-AI Charts gives you four pieces of structural information at a glance:
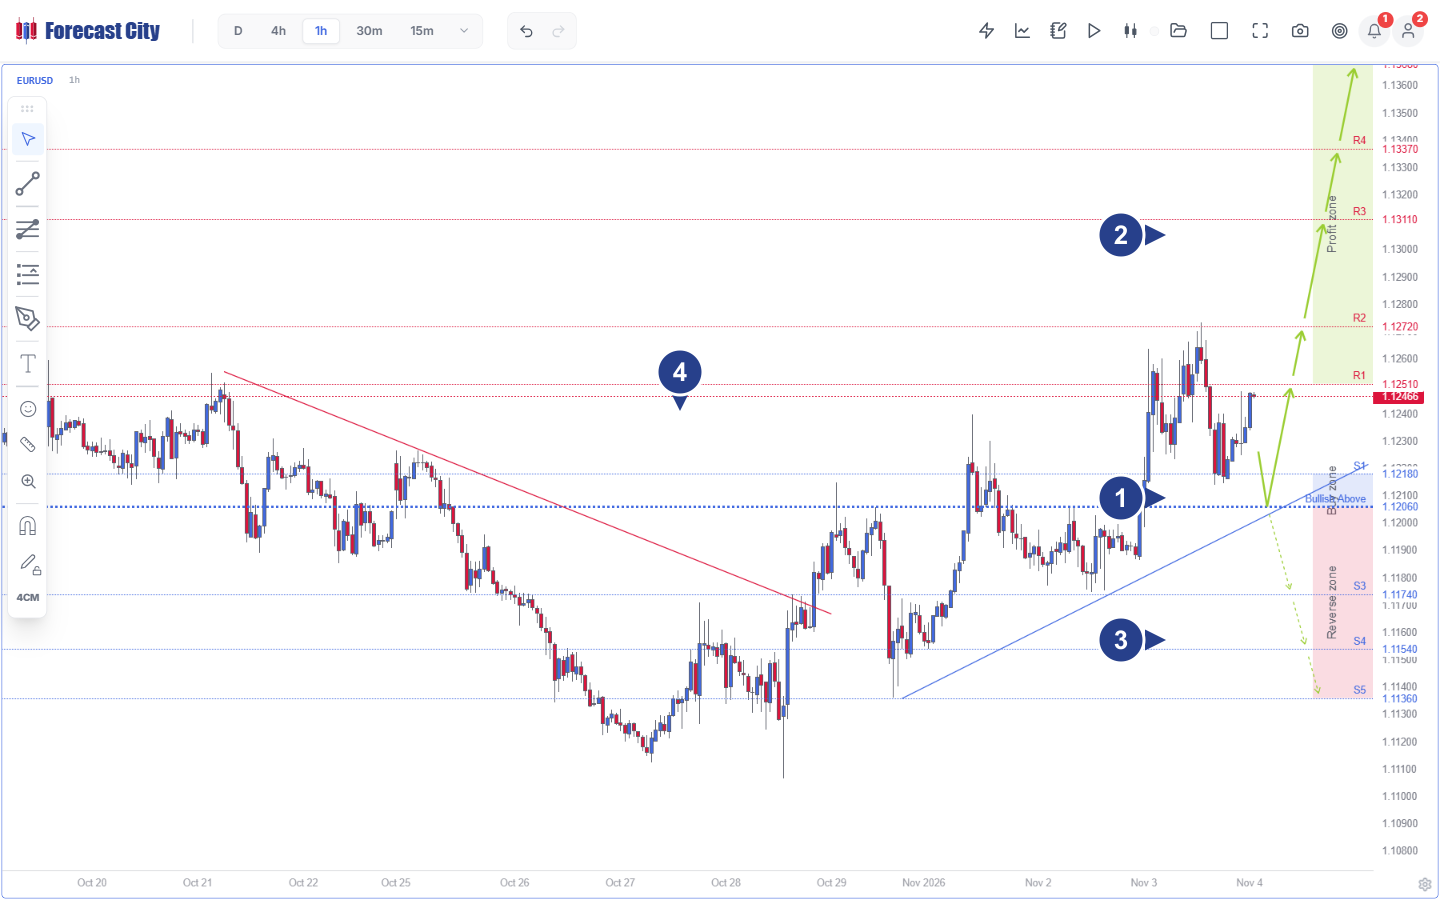
Buy zone (1.12060 to 1.12180) and Pivot: the decision boundary (
Bullish Above 1.12060) and shaded support band up toS1 = 1.12180where buyers stepped in.Solid green arrows and Profit zone (R1 to R5): the expected main path leading through stepped resistance targets at
R1 = 1.12510,R2 = 1.12720,R3 = 1.13110,R4 = 1.13370, andR5 = 1.13680.Dashed green arrows and Reverse zone (S3 to S5): the alternate path below
1.12060. If price breaks the pivot into the Reverse zone, dashed arrows targetS3 = 1.11740,S4 = 1.11540, andS5 = 1.11360.AI resistance and support trend lines: diagonal red resistance and blue support trend lines that confirm the breakout structure.
How does the Quad-AI engine combine technicals and news?
Financial markets do not move on chart patterns alone, and they do not move on headlines alone. ForecastCity uses four specialized AI engines working together in a Quad-AI pipeline:
| AI engine | What it analyzes | How it shapes your chart |
|---|---|---|
| Forecast AI | Candlestick geometry, wave counts, support and resistance (S1–S5, R1–R5), trend lines, and historical volatility (ATR(264, D)). |
Calculates the pivot, the 5 target levels, and the baseline boundaries of the zones (such as 1.12060–1.12180 on EURUSD 1h or 78894.89–79703.62 on BTCUSD 1h). |
| Sentiment AI | Macroeconomic news releases (CPI, FOMC, NFP), central-bank tone, and institutional positioning. |
Scores fundamental pressure and widens entry zones before high-impact news based on past news volatility. |
| Synergy AI | Both the technical output of Forecast AI and the fundamental output of Sentiment AI. |
Merges both streams into one unified roadmap (Unified Strategic Insight) so you never have to guess whether news overrides the chart. |
| Navigator AI | Your chosen trading style, risk settings, and active strategies in AI Strategy Studio and AI Trading Assistant. | Turns the forecast roadmap into personalized entry alerts, lot sizes, and strategy checks. |
How does Sentiment AI adjust zones before major news?
Before a high-impact release such as US inflation (CPI) or Non-Farm Payrolls (NFP), liquidity thins out and price often sweeps 2x to 3x wider than in a quiet session. If a zone stayed narrow during a major announcement, normal news wicks would prematurely invalidate the setup.
When a major economic release approaches, Sentiment AI measures how much that specific report moved the symbol in previous months and widens the Buy zone or Sell zone proportionally. That wider band gives you a realistic support or resistance cushion during news volatility, or reminds you to wait until the initial news candle closes before entering.
Why does ForecastCity publish forecasts instead of signals?
A blind Buy/Sell message tells you Buy EURUSD at 1.1215, SL 1.1190, TP 1.1310 or Sell XAUUSD at 4110, SL 4145, TP 4035 without explaining why or what to do if the market shifts five minutes later. We publish 4CastMachine AI forecasts, not signals, for five concrete reasons:
You see the market structure before price arrives: Because the Buy zone, Sell zone, and Profit zone are drawn ahead of time (such as the
1.12060–1.12180Buy zone onEURUSD 1hor the4106.67–4138.98Sell zone onXAUUSD 15m), you can prepare your plan calmly and set an alert instead of chasing a late message.You wait for real candlestick confirmation inside a zone: Institutional orders sit across a price band, not at one magic number. Waiting for a
HammerorEngulfingcandle inside the zone filters out fakeouts that trap blind limit orders.You know the exact price that invalidates the idea: The Pivot (
1.12060onEURUSD 1h,78894.89onBTCUSD 1h, or4138.98onXAUUSD 15m) tells you down to the pip where the main scenario ends, removing emotional hesitation when a setup fails.You already have Plan B on the chart: On intraday timeframes (
5mto4h), if a sudden news shock breaks the pivot into the Reverse zone, the dashed green arrows immediately show the opposite path and its targets.Every trader can match the roadmap to their own timeframe and risk: A scalper on
5m, a day trader on15mor1h, and a weekend swing trader onDall use the same transparent engine tailored to their own schedule.
Where do I go next?
Now that you know how a forecast is built, open Lesson 2: Read arrows, zones, pivots, and lines on the chart to learn every visual element on 4CM-AI Charts.