
Just because Forex trades 24 hours a day and Crypto trades 24/7 does not mean you should sit in front of your charts all day. In fact, roughly 80% of clean, sustained daily trend moves happen inside just two 3-to-4-hour windows when institutional banking desks in London and New York are actively executing orders: while trading during dead hours exposes you to wide spreads, choppy sideways traps, and stop-hunting wicks. In this final lesson of Grade 1, you will learn how to synchronize your daily routine and your Tell me when alerts with the High-Volume Killzones of each market.
Everyday analogy: rush hour vs. 3:00 AM on a highway: A city highway is open 24 hours a day, yet 80% of commuter traffic flows during the morning and evening rush hours. Financial markets follow the exact same biological clock: price only trends cleanly when commercial banks, hedge funds, and asset managers are sitting at their desks placing billion-dollar orders.
Step 1: The 3 global trading sessions and the 2 daily Killzones
As the Earth rotates from east to west, institutional liquidity passes like a baton across three major financial capitals: Tokyo (Asia), London (Europe), and New York (North America). Look at the two panels in the diagram below to see the 24-hour UTC volume timeline and how an institutional trading day unfolds on a 4CM-AI Charts:
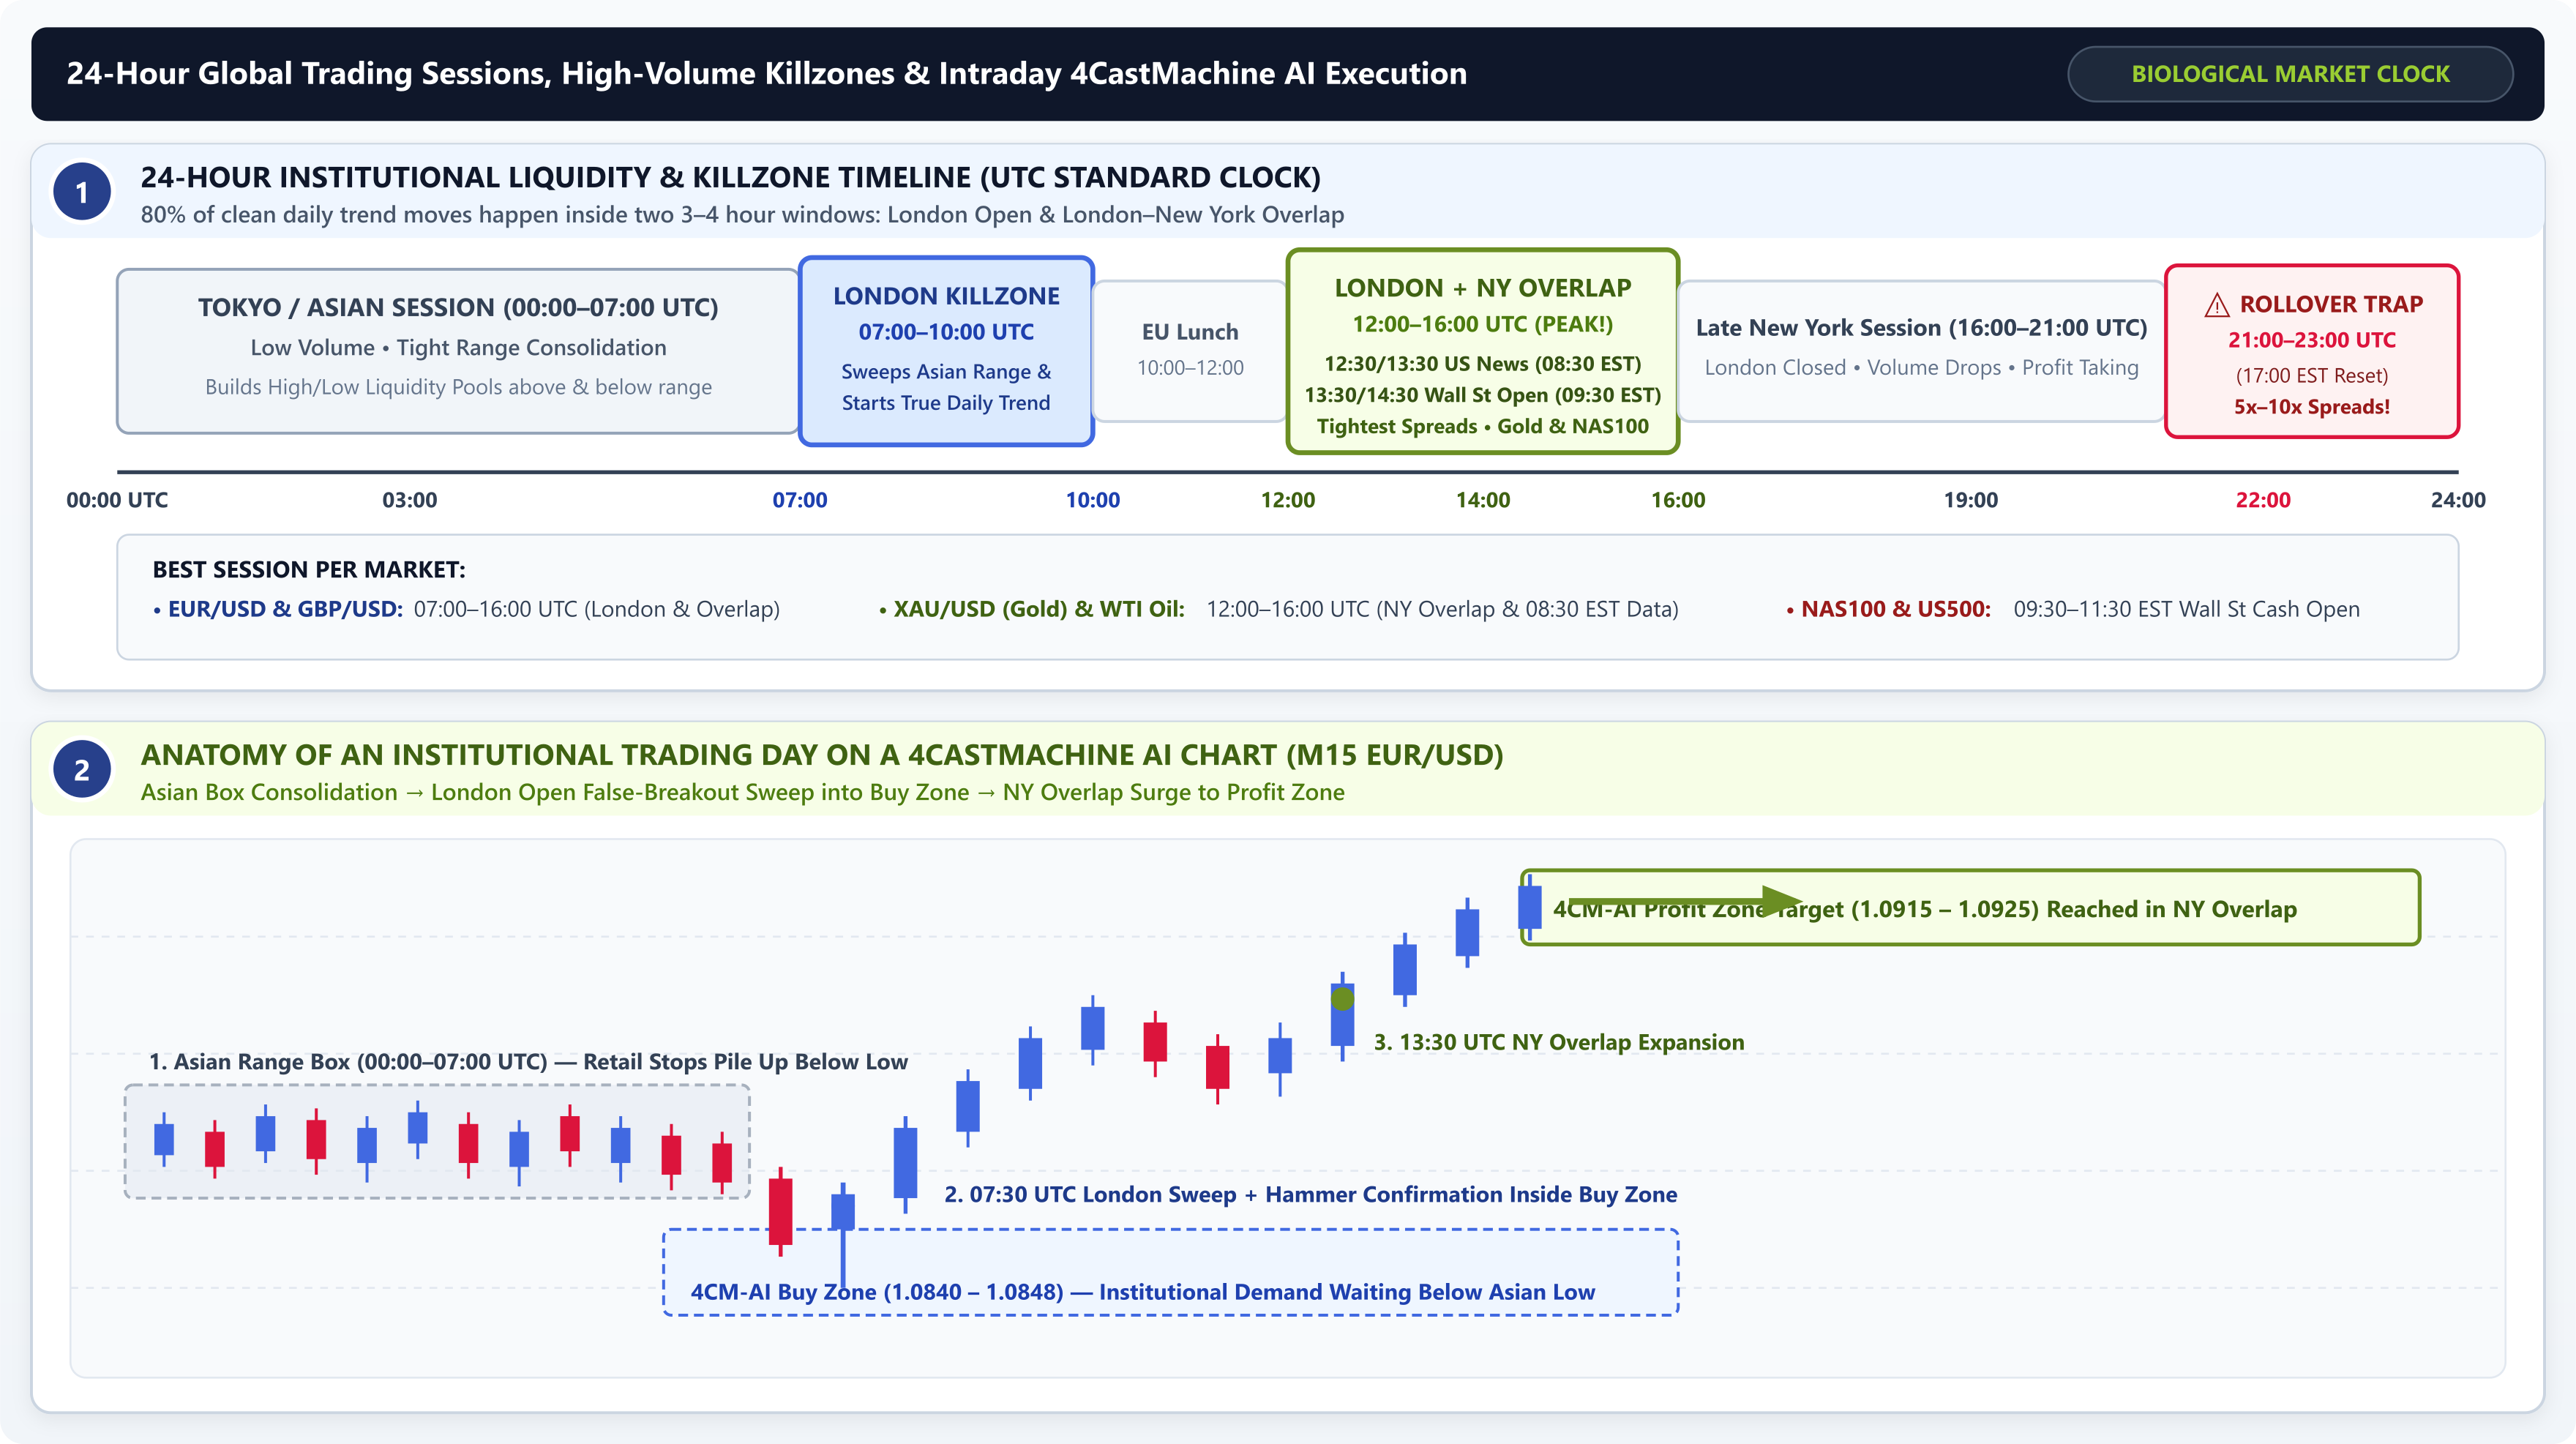
- 24-Hour Institutional Liquidity & Killzone Timeline (Panel 1):
- Tokyo / Asian Session (
00:00–07:00 UTC): European and US banks are closed. Aside from Yen pairs (USD/JPY) and the Australian Dollar (AUD/USD), major pairs likeEUR/USD,GBP/USD, and Gold typically drift inside a tight15–25pip horizontal box called the Asian Range. - Killzone #1: The London Open (
07:00–10:00 UTC): London accounts for roughly38%of global Forex volume. When European desks open at07:00–08:00 UTC, institutional order flow surges, spreads tighten, and the market usually establishes the primary high or low of the day. - Killzone #2: The London–New York Overlap (
12:00–16:00 UTC): For four golden hours every afternoon, both London and New York banks are open simultaneously. This 4-hour window delivers the deepest liquidity, the tightest spreads, and the largest directional moves across Forex, Gold (XAU/USD), Crude Oil (WTI), Stock Indices (NAS100,US500), and Bitcoin (BTC/USD). - The 17:00 EST (
21:00–22:00 UTC) Rollover Trap: When New York closes, banks pause quotes for daily settlement, causing spreads to widen5×to10×.
- Tokyo / Asian Session (
- Anatomy of an Institutional Trading Day on a 4CM-AI Charts (Panel 2):
- Phase 1: Asian Box Consolidation (
00:00–07:00 UTC): Price oscillates sideways inside a narrow box while retail traders place breakout orders and tight stop losses just above the Asian High and below the Asian Low. - Phase 2: London Open Sweep into the 4CM-AI Buy Zone (
07:15–08:00 UTC): Institutional algorithms briefly push price below the Asian Low to sweep those retail stops straight into the waiting 4CastMachine AI Buy zone (1.0840–1.0848). Price rejects the zone, closes a bullishHammerconfirmation candle, and launches the true morning trend. - Phase 3: New York Overlap Expansion to Profit Zone (
13:30–16:00 UTC): After a shallow midday pause during European lunch (10:30–12:00 UTC), US institutional volume enters during the Overlap and drives price straight into the 4CastMachine AI Profit zone (1.0915–1.0925).
- Phase 1: Asian Box Consolidation (
Step 2: The two explosive US timestamps inside the Overlap (08:30 EST & 09:30 EST)
Inside the London–New York Overlap, two exact New York clock times trigger the biggest daily waves across Gold, Forex, Indices, and Crypto:
- 08:30 EST (
13:30 UTCin winter /12:30 UTCin summer): US Macroeconomic News Drop: This is the exact minute the US government releases high-impact economic reports such asCPI(Inflation),NFP(Non-Farm Payrolls),PPI, Retail Sales, andGDP. Because Gold (XAU/USD) and allUSDpairs price directly off US interest-rate expectations, this timestamp triggers massive volatility. (Remember: inside ForecastCity,Sentiment AIautomatically widens Buy/Sell zones ahead of high-impact news to absorb the initial volatility spike.) - 09:30 EST (
14:30 UTCin winter /13:30 UTCin summer): The Wall Street Cash Equity Open: Even thoughNAS100andUS500futures trade 23 hours a day, the actual underlying shares of Apple, Microsoft, and Nvidia on the New York Stock Exchange and Nasdaq only open at 09:30 EST. More than70%of daily index volume: and institutional US Spot Bitcoin ETF inflows: erupt between 09:30 and 11:30 EST.
How Daylight Saving Time (DST) shifts UTC times by 1 hour: Always remember that in late March (Spring/Summer DST) and late October/early November (Autumn/Winter Standard Time), London and New York shift their clocks by 1 hour:
• Winter (Standard Time, Nov–Mar): London Open = 08:00 UTC | US 08:30 News = 13:30 UTC | Wall Street 09:30 Open = 14:30 UTC | NY Rollover = 22:00 UTC.
• Summer (Daylight Saving Time, Mar–Oct): London Open = 07:00 UTC | US 08:30 News = 12:30 UTC | Wall Street 09:30 Open = 13:30 UTC | NY Rollover = 21:00 UTC.
Step 3: Master session matrix & the 3 "Dead Zones" to avoid
Use this reference table to match each market to its prime trading hours and stay completely out of low-liquidity traps:
| Market & Symbols | Prime High-Volume Window (UTC) | Why this window works best | Hours to AVOID opening new trades |
|---|---|---|---|
European Forex (EUR/USD, GBP/USD, USD/CHF) |
07:00–10:00 UTC & 12:00–16:00 UTC |
London bank flows + US Overlap deliver clean zones and sub-1-pip spreads. | 20:00–06:00 UTC (Dead Asian range & 17:00 EST rollover spread spike). |
Asian / Commodity Forex (USD/JPY, AUD/USD, NZD/USD) |
00:00–03:00 UTC & 12:00–16:00 UTC |
Active during Tokyo/Sydney banking hours and again during the US Dollar session. | 21:00–23:00 UTC (Rollover hour where cross-pair spreads widen 10×). |
Gold & Crude Oil (XAU/USD, WTI, BRENT) |
07:30–10:00 UTC & 12:30–16:30 UTC |
London bullion market + NY COMEX/NYMEX open & Wednesday 10:30 EST EIA oil report. |
21:00–23:00 UTC (Daily 1-hour CME maintenance break & wide spreads). |
US Stock Indices (NAS100, US500, US30) |
13:30–16:30 UTC (09:30–12:30 EST) |
Wall Street cash equity open brings real Magnificent-7 stock volume. | 00:00–07:00 UTC (Flat overnight futures drift). |
Cryptocurrencies (BTC/USD, ETH/USD) |
07:00–10:00 UTC & 13:00–17:00 UTC |
Highest institutional Spot ETF and derivatives volume during London & NY hours. | Saturday/Sunday low-volume chop (watch out for fake weekend wicks). |
You have completed Grade 1 of the Multi-Asset Trading Academy. You now know the structural DNA of all four markets, how to calculate exact lot sizes for fixed dollar risk, how to protect Short stops from spreads and rollovers, why to wait for closed reversal candles instead of using blind limit orders, how leverage and margin level work, and which daily Killzones to trade. Put these skills into practice today on 4CM-AI Charts and your Virtual account.