
Choose what the indicator should do
An indicator row compares a value with a number you type, or with a second indicator. crosses above and crosses below are moments. is above and is below are states, which is what you want when the indicator has to stay on one side as part of a bigger rule.
The indicator is measured on the row's own completed candles. That timeframe does not have to match the chart you happen to be looking at.
Example 1: RSI falls below 30
Open the symbol you want to watch, open Alerts and press +.
Choose RSI as the source. The row grows a period box.
Leave the period at 14, or set your own.
Set the row timeframe to 1h.
Choose crosses below and type 30 in the value box.
On Options, choose Once per bar close and set the Confirmation timeframe to 1h.
Check the message and the delivery settings, then press Create.
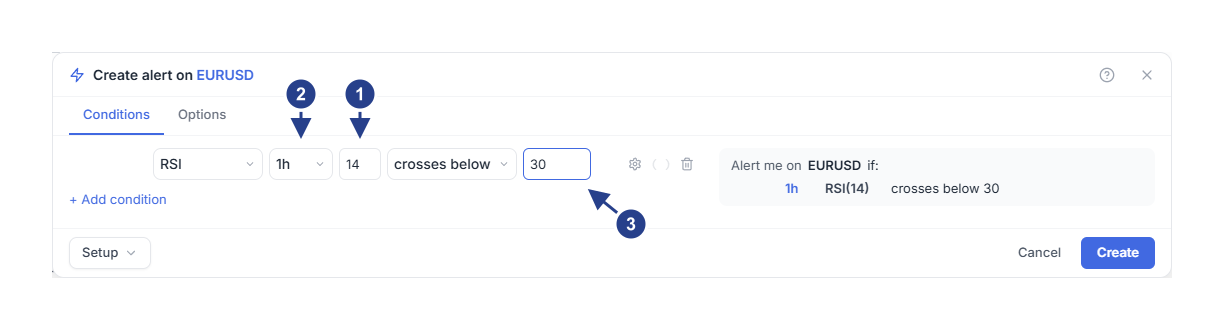
Period: the indicator setting, 14 by default.
Timeframe: the candles this condition is measured on.
Value: the level RSI is compared against.
The alert notices a completed one-hour RSI value moving from above 30 to below it. It is a request to look at the chart, not an instruction to trade.
Use crosses above with 70 for the opposite question. If RSI is already below 30 when the alert starts, the earlier crossing is not replayed.
Example 2: one average crosses another
Suppose you want to see a twenty-period exponential average cross above a fifty-period simple average.
Start another alert and choose EMA, period 20.
Set the row timeframe to 1h and choose crosses above.
Hover the row, open its Details with the gear and set Compare with to Indicator. The value box on the main line disappears, because the comparison now has its own controls, and those stay open under the row.
Choose SMA as the comparison indicator and set its period to 50.
On Options, choose Once per bar close and set the Confirmation timeframe to 1h.
Read the summary, review the notifications and save.
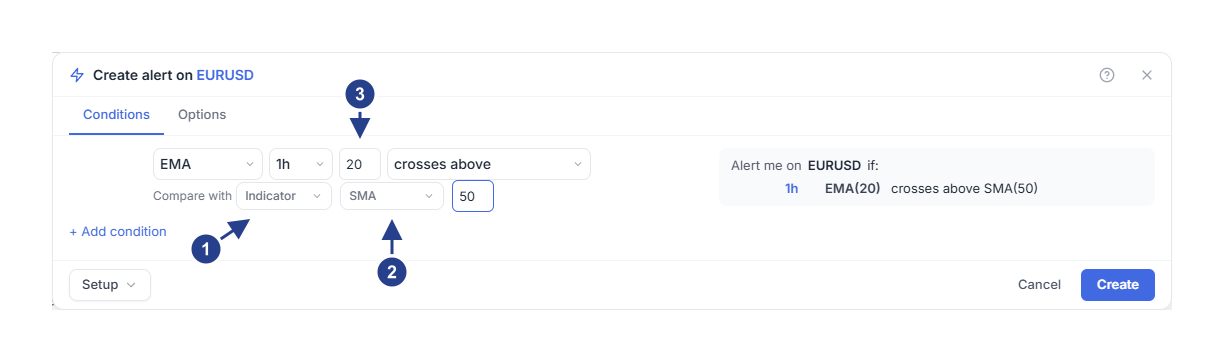
Compare with: switch from a fixed value to a second indicator.
The second average and its own period.
The first average keeps its period on the main line.
Both indicators in the row use that one timeframe, and the crossing is judged on completed candles. Switching the visible chart to five minutes does not change the saved rule.
The comparison indicator offers RSI, EMA, SMA and ATR. A Price row compares with a number you type; to compare price with an average, put the average in its own row and use it as a filter.
Example 3: ATR as a volatility filter
Add a row and choose ATR, period 14.
Choose is above and type a threshold that suits the symbol's price scale.
Set the row timeframe.
Leave the join on and so it filters the event in the row above.
On EURUSD, 0.0010 means that distance in the quote's own units. It does not mean 0.0010% and it has nothing to do with position risk.
Periods for RSI, EMA, SMA and ATR run from 1 to 200. A long period needs more completed history before the first evaluation.
Check the result
After saving, open Edit on the alert and check the indicator, its period, the comparison and the row timeframe. If the chart indicator looks different, compare those four first.
A state that stays true does not create a new event on every candle. Read timeframes, events and repeats for how an alert rearms, or continue with combine conditions to add a higher-timeframe filter.