
Choose the drawing you want to watch
A rectangle defines an area you drew yourself. A Fibonacci alert watches one chosen ratio of a retracement or extension. Both read the drawing's own geometry, and both appear in the editor as a Line row.
These are not the 4CM-AI Buy and Sell zones. A drawing alert never adopts new forecast boundaries; for those use a 4CM-AI zone row.
The chart picker for straight lines does not list every drawing type, so start a rectangle or Fibonacci alert from the drawing's own alert action on the chart.
Example 1: price enters your rectangle
Suppose you drew a review area on EURUSD. The rectangle's upper and lower prices define the area, and its left and right corners define the time span it covers.
Open the chart and select the rectangle. Drag its right corner far enough into the future to cover the period you want to monitor.
Use its alert action, or right-click the drawing and choose the add-alert item. If the drawing already has an alert, this opens that alert for editing instead.
Check the symbol in the window title and the drawing name in the row.
Choose enters.
On Options, choose the trigger you want. Once per bar close judges the zone on completed candles.
Review the message and the notifications, then press Create or Save.
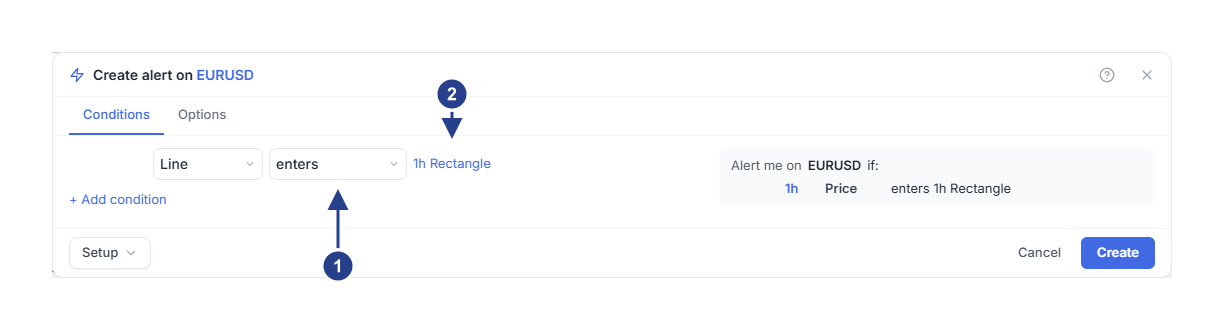
enters: price moves into the rectangle. exits and is inside are the other two.
The rectangle you drew, by its chart name.
Both axes count. The moment being evaluated must lie between the left and right corners, and price must lie between the lower and upper edges. On a bar-close trigger, price that dips in and closes outside does not qualify.
Once time passes the right edge, the drawing is behind you even if price is still between its levels. Move that corner forward when you need a longer watch. The alert's Expiration is a separate setting and does not extend the rectangle.
A rectangle offers three events: enters, exits and is inside. The first two are moments. is inside stays true while price is in the area, which makes it a filter to put beside another row.
A rectangle needs no buffer and no confirmation bar: the area itself is the tolerance, which is why those fields are absent from a rectangle row.
Example 2: watch the 61.8% level
Draw or select a Fibonacci retracement or extension on the symbol.
Open the drawing's alert action.
Check that the row names the Fibonacci drawing you meant.
Hover the row, open its Details with the gear and set Level to 61.8%.
Choose touches.
Set Buffer to a fixed Absolute distance, or keep ATR × for a tolerance that follows volatility.
Choose the trigger you want on Options, then save.
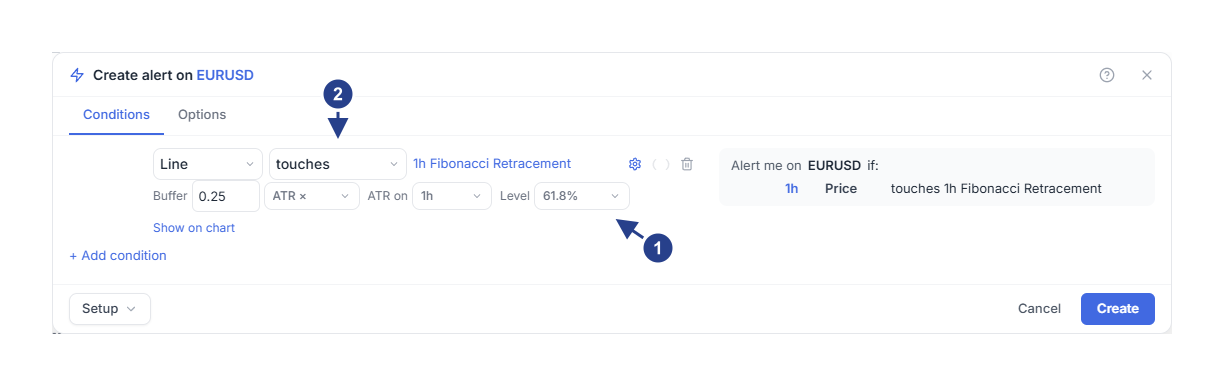
Level: the retracement line the alert watches, 61.8% here.
The same four line events apply to the chosen level.
The alert watches the one ratio you chose, not every visible line. The available ratios are 0%, 23.6%, 38.2%, 50%, 61.8%, 78.6%, 100%, 127.2%, 141.4%, 161.8% and 261.8%.
A Fibonacci level supports the same four line events: touches, approaches, breaks and bounces off. Their buffer and confirmation behaviour is described in chart-line alerts.
Review the geometry before you save
Check the chosen ratio against the chart. The alert calculates the level from the drawing's stored points, so a display option that flips the drawing does not change what was saved.
A linked drawing can still be moved afterwards, and the alert follows it. Deleting the drawing pauses the alerts linked to it. After any significant change to a drawing, open Alerts and confirm that the reference and the status still match what you wanted.
To watch several Fibonacci levels, create one alert per level and check each saved row. The chart's edit action may open the first linked alert, so use the Alerts list when you want a specific one.
Verify the event
Open Log to see whether the event was recorded. If a rectangle entry or a Fibonacci touch did not fire, compare what happened with the trigger and the buffer you chose. How the chart looks does not override those settings.