
What you will build
Attach an alert to a line you drew on the chart. The example watches a confirmed break. The same row watches a touch, an approach or a bounce.
The line can be a horizontal line, a horizontal ray, a trendline, a ray or an extended line. Straight guide-lines drawn by 4CastMachine AI can also be selected.
Pick the line
Open the symbol that carries the line in 4CM-AI Charts.
Right-click the line and choose the add-alert item, or open an alert draft and choose Line as the source, then click Pick on chart and click the line.
If several lines overlap, choose the one you meant from the picker.
Check the line's name in the row, and use Show on chart to see the reference highlighted again.
While an editor is open, right-clicking a line and choosing Add line to alert conditions adds it as another row in the same draft. It does not create a second alert that fires on its own.
Pick a line on the same symbol as the draft. To use another symbol, finish or close the current draft first. Press Escape while picking to cancel the selection; the editor stays open.
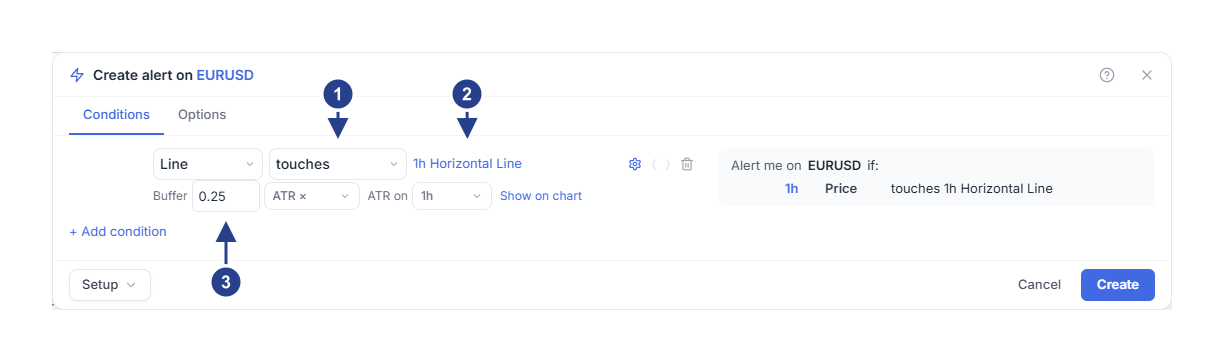
Operator: touches, breaks, bounces off or approaches the line.
The line itself, by its chart name. Click it to pick a different line.
Buffer: how close counts as a touch. ATR × 0.25 follows the market instead of a fixed distance.
Why a line row has no timeframe
Every other row starts with a timeframe because the condition is measured on that candle. A line event is not a candle event: price touches a line the moment it gets there. The summary still prints the chart's timeframe and the word Price in front of a line condition, because every row is read back in the same shape. So the main line of a line row carries no timeframe, and its Details, behind the gear in the row's hover actions, offers one only where it changes what the alert does.
ATR on appears when the buffer is a volatility multiple, because ATR has to be measured somewhere. Confirm on appears for breaks and bounces off, because those two need a candle to close before they are decided.
Example: a confirmed break
Pick your support line.
Choose breaks.
Hover the row and open its Details with the gear. Set Buffer to 0.25 and keep ATR × as its unit.
Set Confirm to 2 bars.
Set Confirm on to 15m, the candle that decides the break.
Review the message and the notifications, then press Create, or Save when you are editing.
This example needs two completed closes beyond the buffer on the far side of the line. A decisive close back on the original side resets the count. A wick through the line is not a confirmed break.
The buffer is the tolerance around the line. ATR × scales it with the volatility of the confirmation timeframe, so the same setting behaves sensibly in a quiet market and a fast one. Absolute is a fixed price distance: 0.0005 on EURUSD means exactly that distance in the quote.
Choose another line event
touches watches price reaching the tolerance around the line.
approaches watches a wider area before the touch. Its distance is a multiple of the buffer, so a 0.25 ATR buffer with distance 3 gives an approach area of 0.75 ATR.
breaks uses completed candles and your confirmation count.
bounces off uses two completed candles: one tests the line and closes clear of it, then the next holds on the same side.
Touch and approach can be judged on live prices, depending on the trigger you chose on the Options tab. Break and bounce always wait for a completed candle. A faster trigger does not turn a wick into a confirmed break.
Understand the reference you picked
A sloped line is read from its stored geometry at the moment being evaluated. A plain trendline only exists between its two anchor times unless it is extended. A ray extends forward, a horizontal ray starts at its anchor, and an extended line continues both ways. Check that the line actually reaches the time you want to monitor.
The alert stays linked to the drawing. Moving the drawing updates the alert's geometry. Deleting the drawing pauses the alerts linked to it, so open Alerts after you remove a chart object.
A machine-drawn line is labelled Fixed forecast reference with its timeframe and version. It watches that version of the guide-line and does not follow a later one from the forecast engine.
For a Buy or Sell zone that moves with the forecast, use a 4CM-AI zone row instead. For rectangles and Fibonacci levels, continue with drawing zones and Fibonacci.
One more thing about size
Each line row carries the line's geometry inside the alert. An alert with about ten line rows reaches the size the engine accepts, and the editor says so before you save rather than failing afterwards. If you see that message, remove a row or split the rule into two alerts.