
Pick the line before the threshold
MACD, Bollinger Bands and Stochastic draw more than one line, so their rows carry a plot chooser in their Details, which the gear in the row's hover actions opens. Choose which line the condition reads, then choose the operator and the value.
All three are measured on completed candles at the row's timeframe. The numbers below teach the controls; they are not recommendations.
Example 1: the MACD histogram crosses zero
Open the symbol and start an alert from Alerts, +.
Choose MACD as the source and set the row timeframe to 1h.
Choose crosses above and type 0 in the value box.
Hover the row and open its Details with the gear. Keep the standard 12, 26 and 9 unless your chart uses other settings.
In the plot chooser, pick hist.
On Options, choose Once per bar close and set the Confirmation timeframe to 1h, then save.
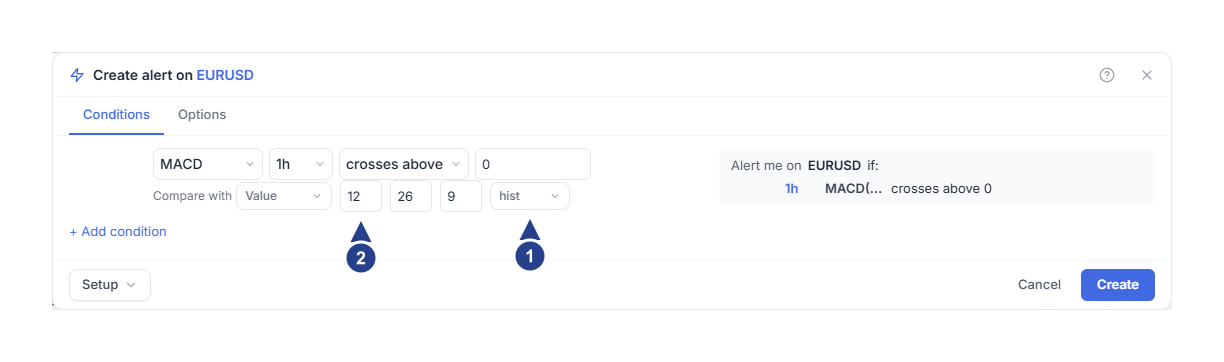
Plot: which of the indicator lines the condition reads.
The indicator settings, here fast, slow and signal.
This notices the histogram moving from below zero to above it on a completed one-hour candle. The line plot watches the MACD line itself instead.
Keep the fast period shorter than the slow one. The Compare with control in Details offers a fixed value or one of the single-line indicators RSI, EMA, SMA and ATR. It cannot compare one MACD plot with another.
Example 2: a Bollinger band crosses a price
Start an alert and choose Bollinger.
Open the row's Details with the gear and set the period to 20 and the standard-deviation multiplier to 2.
Choose upper in the plot chooser.
Choose crosses above and compare with the price you want, for example 1.1000.
Set the row timeframe to 1h, choose Once per bar close, then save.
This watches the upper band's own value crossing your fixed price. It does not mean market price crossed above the band.
The other plots are basis, the middle average, and lower, the lower band. A fixed price channel is a different thing: that is a Price row with the two numbers you type, described in price moves and ranges.
Example 3: Stochastic %K crosses below 80
Choose Stoch in a new alert.
Open the row's Details with the gear and use 14 for the %K period, 3 for %D and 3 for smoothing.
Choose plot k.
Choose crosses below and compare with 80.
Set the row timeframe to 15m, choose Once per bar close, review the delivery and save.
The summary prints the settings you chose, for example STOCH(14, 3, 3), so you can check them without reopening Details. Pick d when you want the smoothed %D line instead.
Review before you save
Check the indicator, every parameter, the plot, the operator, the comparison and the timeframe. Those settings are the alert, whatever the chart indicator happens to be set to.
Use is above or is below when a line should act as a standing filter, and put the event you actually want in another row. Combine conditions shows how the rows are joined. If an indicator has too little history on that timeframe, wait for the candles; choosing it does not skip its calculation.